Answer:
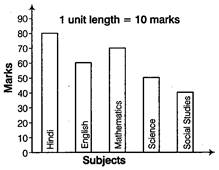
(a) Given bar graph represents the marks obtained by Aziz in half-yearly examination in different subjects. (b) From the bar graph, it is clear that maximum marks are shown by the largest bar. So, Aziz scored maximum marks (i.e. 80 marks) in Hindi. (c) From the bar graph, it is clear that minimum marks are shown by the smallest bar. So, Aziz has scored minimum marks (i.e. 40 marks) in Social Studies. (d) From the bar graph, Aziz's subjects and marks obtained in corresponding subject are as follows:
Subjects Marks Hindi 80 English 60 Mathematics 70 Science 50 Social Studies 40


You need to login to perform this action.
You will be redirected in
3 sec

