| Colors | Number of People |
| Blue | 18 |
| Green | 9 |
| Red | 6 |
| Yellow | 3 |
| Total | 36 |
| Find the proportion of each sector. For example, Blue is \[\frac{18}{36}=\frac{1}{2};\] Green is \[\frac{9}{36}\,=\frac{1}{4}\] and so on. Use this to find the corresponding angles. |
Answer:
Pie chart 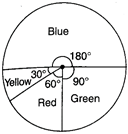
Colors Number of People Proportion Corresponding Blue 18 \[\frac{18}{36}=\frac{1}{2}\] \[\frac{1}{2}\times \,{{360}^{\text{o}}}={{180}^{\text{o}}}\] Green 9 \[\frac{9}{36}=\frac{1}{4}\] \[\frac{1}{4}\times \,{{360}^{\text{o}}}={{90}^{\text{o}}}\] Red 6 \[\frac{6}{36}=\frac{1}{6}\] \[\frac{1}{6}\times \,{{360}^{\text{o}}}={{60}^{\text{o}}}\] Yellow 3 \[\frac{3}{36}\,=\frac{1}{12}\] \[\frac{1}{12}\times \,{{360}^{\text{o}}}={{30}^{\text{o}}}\] Total 36 1 \[{{360}^{\text{o}}}\]


You need to login to perform this action.
You will be redirected in
3 sec

