| Year | 2003 | 2004 | 2005 | 2006 |
| Days | 8 | 10 | 5 | 12 |
| Year | 2003 | 2004 | 2005 | 2006 | 2007 |
| Number of Men | 12 | 12.5 | 13 | 13.2 | 13.5 |
| Number of Women | 11.3 | 11.9 | 13 | 13.6 | 12.8 |
Answer:
(a) 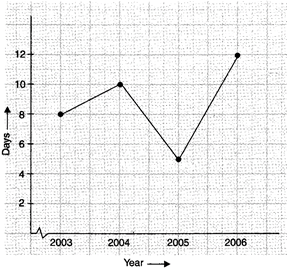 (b)
(b) 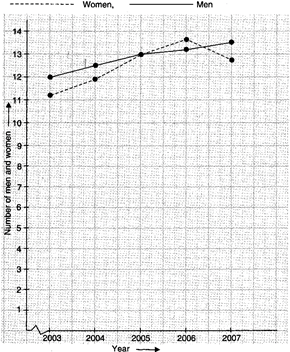


You need to login to perform this action.
You will be redirected in
3 sec

