Population Dynamics
Category : 12th Class
(1) Population density : Population density is the number of individuals present per unit area or volume at a given time. For instance, number of animal per square kilometer, number of trees per area in a forest, or number of plank tonic organism per cubic meter of water. If the total number of individuals is represents by letter N and the number of units of space by Letter S, the population density D can be obtained as \[D=N/S.\] Space is indicated in two dimensions \[({{m}^{2}})\] for land organisms, and in three dimensions \[({{m}^{3}})\] for aquatic organisms and for the organisms suspended in space.
(2) Birth rate or Natality : The birth rate of a population refers to the average number of young ones produced by birth, hatching or germination per unit time (usually per year). In the case of humans, it is commonly expressed as the number of births per 1000 individuals in the population per year.
The maximum birth rate of a species can achieve under ideal environmental conditions is called potential natality. However, the actual birth rate under the existing conditions is much less. It is termed realised natality.
(3) Death rate or mortality : The death rate of a population is the average number of individuals that die per unit time (usually per year). In humans it is commonly expressed as the number of death per 1000 persons in a population per year. Lowest death rate for a given species in most favourable conditions is called potential mortality, while the actual death rate being observed in existing conditions is called realized mortality.
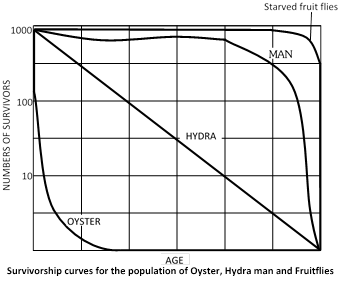
(4) Survivorship curve : The death rate of population can be easily represented by survivorship curve. In this curve time is plotted against number of survivors. There are three kind of survivorship curves.
(i) Diagonal curve : If death rate of different age group organism are equal then the curve is represented or plotted as a straight line.
Example : Hydra, mice and many adult birds.
(ii) Convex curve : When organism completed their potential life spawn and died in old age then the curve is convex, the curves goes horizontal till potential life spawn and then decline rapidly.
Example : Men, rabbit and many mammals.
(iii) Concave curve : This kind of curve most found in such organism who die before their potential life spawn.
Example : Fish, Oysters and Invertibrates.
(5) Vital index : The percentage ratio of natality over mortality is known as vital index i.e. natality / mortality \[\times 100.\] It determines the growth of a population.
(6) Immigration : It is permanent entry of additional person into the existing population of a country or region from out side. Example; Many Nepalese and Chinese come to settle in India.
(7) Emigration : It is the permanent departure of some persons from the existing population of a region to a different state or a foreign country. Example; Many Indians go to Western countries to settle there.
Immigration and emigration bring about redistribution of population, and are common in animals. These occur for various reasons, such as search for food, escape from competition due to overcrowding, need of shelter etc.
(8) Sex ratio : The number of females in a population per 1000 males is called sex ratio.
Sex ratio =\[\frac{No.\,of\,females}{1000\,(males)}\]
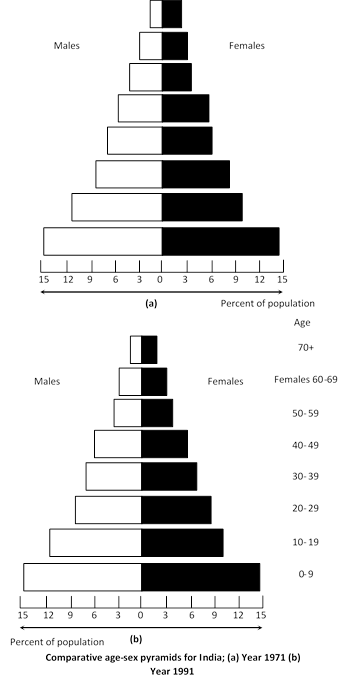
(9) Age structure : The age structure of a population is the percentage of individual of different ages such as young, adult and old. Age-sex structure of a population can be shown by a pyramid-like diagram by plotting the percentage of population of each sex in each age-group. Figure shows the age-sex structural pyramids for India over the 20-year period from 1971 to 1991. These pyramids show that Indian population may still take many years to be stabilized.
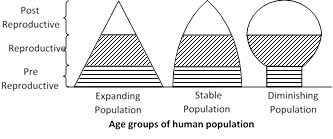
(10) Age distribution : The relative abundance of the organisms of various age groups in the population is called age distribution of population. With regard to age distribution, there are three kinds of population.
(i) Rapidly growing or Expanding population : It has high birth rate and low death rate, so there are more number of young individuals in the population.
(ii) Stationary or stable population : It has equal birth and death rates, so population shows zero population growth. The pyramid of this type of population is ‘bell’ shaped.
(iii) Declining population : It has higher death rate than birth rate, so the population of young members is lower than that of old members e.g. Japan (Ageing population). The pyramid of this type of population is ‘urn’ shaped.
Human population has three age groups : Pre reproductive, Reproductive, and post reproductive.
Factors affecting the age composition
(i) Number of infants below one year of age and the older people as these have higher mortality rate than individuals of other age groups.
(ii) Proportion of reproductive active males and females in a population.
(iii) Number of females in active reproductive age (i.e. between 15 to 44 years)
(11) Change in Population Size and Growth Rate : Whether a population grows, declines or maintains it size depends upon the balance between the above factors:
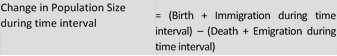
The above expression in words may be represented in a simple way by a mathematical model. suppose \[N=\]population size and t = time. The Greek letter delta, \[\Delta ,\] indicates change. We can now represent change in population as \[\Delta N,\] and time interval as \[\Delta t.\] The verbal equation can be written as \[\Delta N/\Delta t=(B+I)-(D+E)\] in which B is absolute number of births in the population during the time interval, and D =the absolute number of deaths during that interval; I means immigrant and E, emigrants. I and E , being insignificant, may be ignored. Then the equation simplifies to \[\Delta N/\Delta t=B-D.\]
Migration is a two-way movement of a population for adjusting to seasonal changes. It occurs in some fishes (Anguilla, an eel), birds (Siberian crane), and mammals (fur seal). Migration is not considered a determinant of population size.
Annual average growth rate is the percentage of increase in population size per year. It can be calculated with the help of following equation:
\[Annual\text{ }growth\text{ }rate\text{ }(%)\text{ }=\left( \frac{{{P}_{2}}-{{P}_{1}}}{{{P}_{1}}\times N} \right)\times 100\]
Where \[{{P}_{1}}=\] Population size of previous census. \[{{P}_{2}}=\]Population size of present census.
\[N=\]Number of years between the two census.


You need to login to perform this action.
You will be redirected in
3 sec

