Pictograph and Its Use
Category : 3rd Class
![]() Introduction
Pictograph is referred as the representation of data in
picture form. In ancient time pictographs were only the method for writing the
information. Numbers were also represented in picture form. Now a day
pictographs are used for the analysis of data. In this chapter we will learn
about the pictorial representation of data.
Introduction
Pictograph is referred as the representation of data in
picture form. In ancient time pictographs were only the method for writing the
information. Numbers were also represented in picture form. Now a day
pictographs are used for the analysis of data. In this chapter we will learn
about the pictorial representation of data.
![]() Pictograph and
its Use
Information about anything in the form of picture is called
pictograph. There are different types of graphs which are used for the
representation of data. These are bar graph, line graph, Venn diagram.
Pictograph and
its Use
Information about anything in the form of picture is called
pictograph. There are different types of graphs which are used for the
representation of data. These are bar graph, line graph, Venn diagram.
![]() Representation of
Data by Pictograph
v A
picture of a house
Representation of
Data by Pictograph
v A
picture of a house![]() represents one
house.
v Pictures
of two house
represents one
house.
v Pictures
of two house![]()
![]() represent 2
house.
v If
one picture of a house
represent 2
house.
v If
one picture of a house![]() represents 6 house then
the pictures of2 house
represents 6 house then
the pictures of2 house![]()
![]() will represent
will represent ![]() house.
From the above representation of data we can say that a big
quantity is represented by a symbol which is called pictorial representation of
data.
house.
From the above representation of data we can say that a big
quantity is represented by a symbol which is called pictorial representation of
data.
![]()
![]() represents 12 pencils. The symbol
represents 12 pencils. The symbol![]() will
represent?
(a) 48
(b) 70
(c) 80
(d) All of these
(e) None of these
Answer (a)
Expirations
will
represent?
(a) 48
(b) 70
(c) 80
(d) All of these
(e) None of these
Answer (a)
Expirations
![]() = 12 pencils
therefore, four number of such pencils = 12 x 4 = 48 pencils.
= 12 pencils
therefore, four number of such pencils = 12 x 4 = 48 pencils.
![]() Data
Information about the things is called data. A surveyor
conducts a survey regarding the T.V users in 4 areas A, B, C, D in a city and
obtain the data: 50, 60, 45, 40.
Row data is arranged in table as shown below:
Data
Information about the things is called data. A surveyor
conducts a survey regarding the T.V users in 4 areas A, B, C, D in a city and
obtain the data: 50, 60, 45, 40.
Row data is arranged in table as shown below:
| Area | Number of T.V users |
| A | 40 |
| B | 45 |
| C | 50 |
| D | 60 |
| Sections | Number of students |
| A | 60 |
| B | 75 |
| C | 45 |
| D | 30 |
| Sections | Number of students |
| A |
|
| B |
|
| C |
|
| D |
|

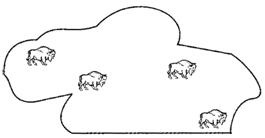 (a) 1000
(b) 4000
(c) 2000
(d) 6000
(e) None of these
Answer (b)
Explanation
Total number of buffaloes
(a) 1000
(b) 4000
(c) 2000
(d) 6000
(e) None of these
Answer (b)
Explanation
Total number of buffaloes
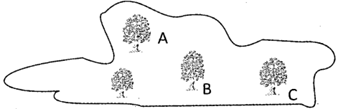 (a) 37050
(b) 37034
(c) 49380
(d) All of these
(e) None of these
Answer (c)
Explanations
Total trees in the state
(a) 37050
(b) 37034
(c) 49380
(d) All of these
(e) None of these
Answer (c)
Explanations
Total trees in the state (b)
(b)  (c)
(c)  (d) all of these
(e) None of these
Answer: (b)
Explanations
(d) all of these
(e) None of these
Answer: (b)
Explanations
 = 10 students.
Hence,
= 10 students.
Hence,  v Earliest
pictograph was used by Chinese.
v Pictograph
is the convenient method to communicate with those who cannot understand
written and verbal communication.
v There
is standard representation of pictograph which is accepted globally.
v Letters
and words were used in picture form.
v Ancient
pictographs are still in use for written communication among some illiterate
societies in Africa
v Earliest
pictograph was used by Chinese.
v Pictograph
is the convenient method to communicate with those who cannot understand
written and verbal communication.
v There
is standard representation of pictograph which is accepted globally.
v Letters
and words were used in picture form.
v Ancient
pictographs are still in use for written communication among some illiterate
societies in Africa


You need to login to perform this action.
You will be redirected in
3 sec

