STATISTICS
Category : 9th Class
Learning Objectives:
DATA:
A collection of numerical figures giving some particular type of information is called data.
Example: The marks obtained by 10 students in a class test (out of 50) are:
24, 43, 49, 38, 36, 36, 31, 40, 42, 15.
Raw data: Data obtained in original form is known as raw data. Data given in above example is raw data.
ARRAY:
Arranging the data in ascending or descending order is known as array. Like in above example on arranging the above data in ascending order will be as:
15, 23, 31, 36, 36, 38, 40, 42, 43, 49.
It is known as array.
TABULATION OF DATA:
Arranging the data in form of table is known as tabulation of data.
OBSERVATION:
Each numerical figure in a data is called observation.
FREQUENCY OF AN OBSERVATION:
The number of times a particular observation occurs is called its frequency. In above example 36 occurs two times so its frequency is 2.
STATISTICS:
Statistics deals with the collection, presentation, analysis and interpretation of numerical data.
MEAN OF UNGROUPED DATA:
\[\text{Mean:}\,\,\frac{\text{Sum of the given observations}}{\text{No}\text{. of given observations}}\]
Example: Find the mean of the numbers
7, 6, 8, 9, 5, 4, 3, 7, 8, 2
Solution: Sum of the given numbers = 7 + 6 + 8 + 9 + 5 + 4 + 3 + 7 + 8 + 2 = 59
No. of given observation = 10
\[\text{Mean}=\frac{59}{10}=5.9\]
MEAN OF TABULATED DATA:
If the frequency of \[n\] observation \[{{x}_{1}},{{x}_{2}},{{x}_{3}}........{{x}_{n}}\] are \[{{f}_{1}},{{f}_{2}},{{f}_{3}}.........{{f}_{n}}\] respectively then
\[\text{Mean}=\frac{({{f}_{1}}{{x}_{1}}+{{f}_{2}}{{x}_{2}}+{{f}_{3}}{{x}_{3}}.....{{f}_{x}}{{x}_{n}})}{({{f}_{1}}+{{f}_{2}}+{{f}_{3}}.....{{f}_{n}})}=\frac{\Sigma ({{f}_{i}}\times {{x}_{i}})}{\Sigma {{f}_{i}}}\]
\[\Sigma =\]Greek letter showing summation
Example: The following table shows the weight of 15 workers in a factory.
|
Weight (kg) |
60 |
63 |
66 |
72 |
75 |
|
No of workers |
4 |
5 |
3 |
1 |
2 |
Calculate the mean weight.
Solution: For calculating mean weight, we prepare following table.
|
Weight (kg)\[{{x}_{1}}\] |
No. of workers |
\[{{f}_{1}}\times {{x}_{1}}\] |
|
60 |
4 |
240 |
|
63 |
5 |
315 |
|
66 |
3 |
198 |
|
72 |
1 |
72 |
|
75 |
2 |
150 |
|
|
\[\Sigma {{f}_{1}}=15\] |
\[\Sigma {{f}_{1}}{{x}_{1}}=975\] |
Example: Calculate the mean for the following data:
|
Marks |
24 |
25 |
19 |
15 |
20 |
22 |
|
No. of students |
3 |
5 |
4 |
5 |
2 |
3 |
Solution: We may prepare the table given below:
|
Marks\[({{x}_{i}})\] |
No. of students \[({{f}_{i}})\] |
Cumulative frequency |
\[({{f}_{i}}\times {{x}_{i}})\] |
|
15 |
5 |
5 |
75 |
|
19 |
4 |
9 |
76 |
|
20 |
2 |
11 |
40 |
|
22 |
3 |
14 |
66 |
|
24 |
3 |
17 |
72 |
|
25 |
5 |
22 |
125 |
|
|
\[N=\Sigma {{f}_{i}}=22\] |
|
\[\Sigma ({{f}_{i}}\times {{x}_{i}})\]\[=454\] |
Here, \[N=\Sigma {{F}_{i}}=22\]Which is even.
\[\text{Mean}=\frac{\Sigma ({{f}_{i}}\times {{x}_{i}})}{\Sigma {{f}_{i}}}=\frac{454}{22}=20.63\]
MODE
Putting the same observations together and counting them is not easy if the number of observations is large. In such cases we tabulate the data. Tabulation can begin by putting tally marks and finding the frequency, as we did in grouped data.
Look at the following example:
Following are the margins of victory in the football matches of a league.
1, 3, 2, 5, 1, 4, 6, 2, 5, 2, 2, 2, 4, 1, 2, 3, 1, 1, 2, 3, 2, 6, 4, 3, 2, 1, 1, 4, 2, 1, 5, 3, 3, 2, 3, 2, 4, 2, 1, 2
Find the mode of this data.
Let us put the data in a tabular form:
|
Margins of victory |
Tally bars |
Number of Matches |
|
1 |
\[\bcancel{|\,\,|\,\,|\,\,|} \,\,|\,\,|\,\,|\,\,|\] |
9 |
|
2 |
\[\bcancel{|\,\,|\,\,|\,\,|} \bcancel{|\,\,|\,\,|\,\,|}|\,\,|\,\,|\,\,|\] |
14 |
|
3 |
\[\bcancel{|\,\,|\,\,|\,\,|}\,\,\,|\,\,|\] |
7 |
|
4 |
\[\bcancel{|\,\,|\,\,|\,\,|}\] |
5 |
|
5 |
\[|\,\,|\,\,|\] |
3 |
|
6 |
\[|\,\,|\] |
2 |
|
|
Total |
40 |
Looking at the table, we can quickly say that 2 is the 'mode' since 2 has occurred the highest number of times.
Thus, the most frequent victory margin is 2 goals in the league.
MEDIAN:
After arranging the given data in ascending or descending order, the value of middle-most observation is called median of the data.
MEDIAN OF UNGROUPED DATA:
Arrange the data in ascending or descending order. If the total no of observation are n.
Case 1: When \[n\] is odd:
Median \[=\left( \frac{n+1}{2} \right)\text{th}\]observation value
Case 2: When \[n\] is even
Media\[=\frac{1}{2}\left\{ \frac{n}{2}th+\left( \frac{n}{2}+1 \right)\text{th}\,\text{observation}\,\text{value} \right\}\]
Example: The runs scored by 1 members of cricket teams
38, 29, 54, 36, 78, 82, 59, 38, 16, 40, 60
Find the median score.
Solution: On arranging the numbers in ascending order
16, 29, 36, 38, 38, 40, 54, 59, 60, 78, 82
Here n = 11 which is odd
\[\therefore \] Median score
\[=\frac{1}{2}(n+1)th\]term value
\[=\frac{1}{2}(11+1)=\frac{1}{2}\times 12=\]6th term value.
So median = 40.
Example: The weight of 8 students (in kg) are:
32, 38, 40, 30, 41, 35, 43, 30.
Find the median weight.
Solution: Arranging the weight in ascending order
30, 30, 32, 35, 38, 40, 41, 43.
Here \[n=8\]
\[\therefore \] Median weight
\[=\frac{1}{2}\left\{ \frac{\text{nth}\,\text{term}\,\text{value}}{\text{2}}+\left( \frac{n}{2}+1 \right)\text{th}\,\text{term}\,\text{value} \right\}\]
\[=\frac{1}{2}\left\{ \frac{8}{2}+\left( \frac{8}{2}+1 \right) \right\}\]
\[=\frac{1}{2}\]{4th term value + 5th term value}
\[=\frac{1}{2}\times (35+38)=\frac{1}{2}\times 73=36.5\,kg\]
Example: We have the following observations in ascending order of magnitude:
\[11,\,\,12,\,\,14,\,\,18,\,\,x+2,\,\,x+4,\,\,30,\,\,32,\,\,35,\,\,41\]
If the median is 24 find the value of\[x.\]
Solution:
Here n = 10 (even)
\[\text{Median}=\frac{\frac{n}{2}\text{th observation}+\left( \frac{n}{2}+1 \right)\text{th observation}}{2}\]
\[24=\frac{\frac{10}{2}\text{th observation}+\left( \frac{10}{2}+1 \right)\text{th observation}}{2}\]
\[24=\frac{\text{5th observation + 6th observation}}{2}\]
\[24=\frac{(x+2)+(x+4)}{2}\]
\[\Rightarrow \,\,24=\frac{2x+6}{2}\Rightarrow 24=x+3\]
\[\Rightarrow \,\,x=21\]
BAR GRAPHS
Two hundred students of 6th and 7th class were asked to name their favorite colour so as to decide upon what should be the colour of their school building. The results are shown in the following table. Represent the given data on a bar graph.
|
Favourite Colour |
Red |
Green |
Blue |
Yellow |
Orange |
|
Number of Students |
43 |
19 |
55 |
49 |
34 |
Answer the following questions with the help of the bar graph:
(i) Which is the most preferred colour and which is the least preferred?
(ii) How many colours are there in all? What are they?
Choose a suitable scale as follows:
Start the scale at 0. The greatest value in the data is 55, so end the scale at a value greater than 55, such as 60.
Use equal divisions along the axes, such as increments of 10. You know that all the bars would lie between 0 and 60. We choose the scale such that the length between 0 and 60 is neither too long nor too small. Here we take 1 unit for 10 students.
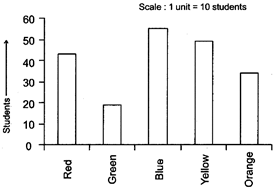
We then draw and label the graph as shown.
From the bar graph we conclude that
(i) Blue is the most preferred colour (Because the bar representing Blue is the tallest).
(ii) Green is the least preferred colour. (Because the bar representing Green is the shortest).
(iii) There are five colours. They are Red, Green, Blue, Yellow and Orange. (These are observed on the horizontal line)
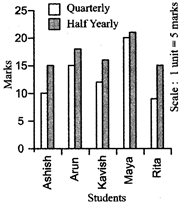
A mathematics teacher wants to see whether the new technique of teaching she applied after the quarterly test was effective or not. She takes the scores of the 5 weakest children in the quarterly test (out of 25) and in the half yearly test (out of 25):
|
Students |
Ashish |
Arun |
Kavish |
Maya |
Rita |
|
Quarterly |
10 |
15 |
12 |
20 |
9 |
|
Half yearly |
15 |
18 |
16 |
21 |
15 |
Since there seems to be a marked improvement in most of the students, the teacher decides that she should continue to use the new technique of teaching.
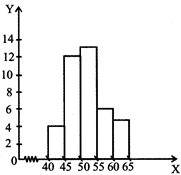
HISTOGRAM
Example 1:
The frequency distribution of weights (in kg) of 40 persons of a locality is given.
|
Weight (in kg) |
40–45 |
45–50 |
50–55 |
55–60 |
60–65 |
|
Frequency |
4 |
12 |
13 |
6 |
5 |
Solution:
Construct a histogram to represent the above data.
PROBABILITY
There are situations in our life that are certain to happen, some that are impossible and some that may or may not happen. The situation that may or may not happen not happen has chance of happening.
We know that when a coin is thrown, it was possible outcomes, Head or Tail. For a dice we have 6 possible outcomes. We also know from experience that for a coin, Head or Tail is equally likely to be obtained. We say that the probability of getting Head or Tail is equal and is\[\frac{1}{2}\]for each.
For a dice, probability of getting either of 1, 2, 3, 4, 5, or 6 is equal. That is, for a dice there are 6 equally likely possible outcomes. We say each of 1, 2, 3, 4, 5, 6 has one-sixth\[\left( \frac{1}{6} \right)\]probability.


You need to login to perform this action.
You will be redirected in
3 sec

