Bar Graphs
Category : 9th Class
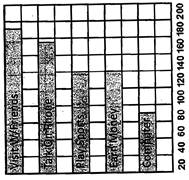
Bar graph is an excellent way to show results in graphical form that is one time, and isn't continuous - especially samplings such as surveys, inventories, etc. Below is a typical survey asking students about their activities after school. Notice that in this graph each column is labelled - it is also possible to label the category to the left of the bar.
Favorite Activity of Students after School
| Activity | Number |
| Visit Friends | 175 |
| Talk on Phone | 168 |
| Play Sports | 120 |
| Earn Money | 120 |
| Computers | 65 |
Favorite Activity of Students after school


You need to login to perform this action.
You will be redirected in
3 sec

