-
question_answer1)
Which of the following is the number of times a particular item occurs in a class interval?
A)
Mean done
clear
B)
Frequency done
clear
C)
Cumulative frequency done
clear
D)
Median done
clear
View Solution play_arrow
-
question_answer2)
What are the groups into which large data is condensed called?
A)
Class limits done
clear
B)
Classes done
clear
C)
Class size done
clear
D)
Class width done
clear
View Solution play_arrow
-
question_answer3)
Find the mean of first 5 whole numbers.
A)
2.5 done
clear
B)
3 done
clear
C)
1.5 done
clear
D)
2 done
clear
View Solution play_arrow
-
question_answer4)
The relative humidity (in %) of a city for 10 days is given in the box.
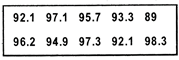
Determine its range.
A)
9.3 done
clear
B)
9.6 done
clear
C)
9.5 done
clear
D)
9.8 done
clear
View Solution play_arrow
-
question_answer5)
The demand for different shirt sizes, as obtained from a survey, is given in the table.
| Size | 38 | 39 | 40 | 41 | 42 | 43 | 44 |
| No. of persons | 26 | 36 | 230 | 15 | 13 | 7 | 5 |
Find the modal shirt size.
A)
39 done
clear
B)
40 done
clear
C)
44 done
clear
D)
42 done
clear
View Solution play_arrow
-
question_answer6)
The class marks of a frequency distribution are given as 15, 20, 25,............ Find the class corresponding to the class mark 20.
A)
12.5-17.5 done
clear
B)
17.5-22.5 done
clear
C)
18.5-21.5 done
clear
D)
19.5-20.5 done
clear
View Solution play_arrow
-
question_answer7)
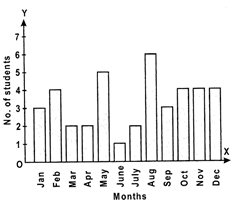
Direction: The bar graph given shows the months of birthdays of 40 students of a class.

| Answer the following questions based on the graph. |
How many students were born in August?
A)
6 done
clear
B)
4 done
clear
C)
5 done
clear
D)
3 done
clear
View Solution play_arrow
-
question_answer8)
Direction: The bar graph given shows the months of birthdays of 40 students of a class.
| Answer the following questions based on the graph. |
In which month were the minimum number of students born?
A)
February done
clear
B)
June done
clear
C)
December done
clear
D)
May done
clear
View Solution play_arrow
-
question_answer9)
Direction: The bar graph given shows the months of birthdays of 40 students of a class.
| Answer the following questions based on the graph. |
In which months were at least 5 students born?
A)
June and October done
clear
B)
March and November done
clear
C)
February and September done
clear
D)
May and August done
clear
View Solution play_arrow
-
question_answer10)
Direction: The bar graph given shows the months of birthdays of 40 students of a class.
| Answer the following questions based on the graph. |
In which months was the difference in the number of students born the same as that in October and November?
A)
February and January done
clear
B)
May and July done
clear
C)
March and April done
clear
D)
August and September done
clear
View Solution play_arrow
-
question_answer11)
Find the median of the first ten prime numbers.
A)
24 done
clear
B)
14 done
clear
C)
12 done
clear
D)
22 done
clear
View Solution play_arrow
-
question_answer12)
In a school 90 boys and 30 girls appeared for a public examination. The mean marks of boys was found to be 45% whereas the mean marks of girls was 70%. What is the average marks % of the school?
A)
61.50% done
clear
B)
51.25% done
clear
C)
40.50% done
clear
D)
51.52% done
clear
View Solution play_arrow
-
question_answer13)
What is a graph drawn with the midpoints of the top sides of the rectangles forming the histogram of a frequency distribution called?
A)
Bar graph done
clear
B)
Ogive done
clear
C)
Frequency polygon done
clear
D)
Frequency curve done
clear
View Solution play_arrow
-
question_answer14)
What do you call the value in a data around which the values of all the other observations tend to concentrate?
A)
Common value done
clear
B)
Range done
clear
C)
Measure of central tendency done
clear
D)
Midvalue done
clear
View Solution play_arrow
-
question_answer15)
Of the class intervals 10 - 20 and 20 - 30, the number 20 is included in which of the following?
A)
10-20 done
clear
B)
20-30 done
clear
C)
15-20 done
clear
D)
Both (a) and (b) done
clear
View Solution play_arrow
-
question_answer16)
Find the arithmetic mean of 30,36,39,23 and 27.
A)
28 done
clear
B)
20 done
clear
C)
31 done
clear
D)
35 done
clear
View Solution play_arrow
-
question_answer17)
The median of given observations arranged in ascending order is 25.
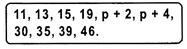
Find p,
A)
22 done
clear
B)
24 done
clear
C)
21 done
clear
D)
26 done
clear
View Solution play_arrow
-
question_answer18)
Which one of the following is not a measure of central tendency?
A)
Mean done
clear
B)
Range done
clear
C)
Median done
clear
D)
Mode done
clear
View Solution play_arrow
-
question_answer19)
Direction: The following is a chart showing the temperature of a patient recorded at different times.
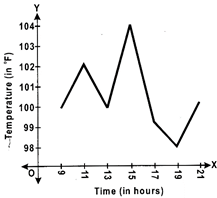
| Read the temperature chart and answer the given questions. |
What is the temperature of the patient at 21 hrs?
A)
100°F done
clear
B)
101°F done
clear
C)
102°F done
clear
D)
103°F done
clear
View Solution play_arrow
-
question_answer20)
Direction: The following is a chart showing the temperature of a patient recorded at different times.
| Read the temperature chart and answer the given questions. |
What is the percentage increase in temperature between 9 hrs and 15 hrs?
A)
4% done
clear
B)
3% done
clear
C)
2% done
clear
D)
1% done
clear
View Solution play_arrow
-
question_answer21)
Direction: The following is a chart showing the temperature of a patient recorded at different times.
| Read the temperature chart and answer the given questions. |
What is the percentage decrease in temperature between 17 hrs and 19 hrs?
A)
1.02% done
clear
B)
1.03% done
clear
C)
1.04% done
clear
D)
1.01% done
clear
View Solution play_arrow
-
question_answer22)
Direction: The following is a chart showing the temperature of a patient recorded at different times.
| Read the temperature chart and answer the given questions. |
What is the average temperature of the patient between 13, 15 and 17 hrs?
A)
\[103{}^\circ F\] done
clear
B)
\[102{}^\circ F\] done
clear
C)
\[101{}^\circ F\] done
clear
D)
\[100{}^\circ F\] done
clear
View Solution play_arrow
-
question_answer23)
The mean of first 8 observations is 18 and last 8 observations is 20. If the mean of all 15 observations is 19, find the 8th observation.
A)
18 done
clear
B)
12 done
clear
C)
19 done
clear
D)
20 done
clear
View Solution play_arrow
-
question_answer24)
A grouped frequency distribution table with classes of equal sizes using 63 ? 72 (72 included) as one of the classes is constructed for the following data.
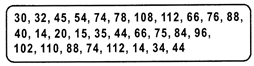
Find the number of classes in the distribution.
A)
9 done
clear
B)
11 done
clear
C)
10 done
clear
D)
12 done
clear
View Solution play_arrow
-
question_answer25)
The mid-point of a class is m and \[l\] is the upper class limit in a continuous frequency distribution. Which of the following would be the lower class limit of the class?
A)
\[2m+l\] done
clear
B)
\[2m-l\] done
clear
C)
\[m-l\] done
clear
D)
\[m-2l\] done
clear
View Solution play_arrow
-
question_answer26)
The width of each of nine classes in a frequency distribution is 2.5 and the lower class boundary of the lowest class is 10.6. What is the upper class boundary of the highest class?
A)
35.6 done
clear
B)
33.1 done
clear
C)
30.3 done
clear
D)
28.1 done
clear
View Solution play_arrow
-
question_answer27)
In a frequency distribution, the mid value of a class is 10 and the width of the class is 6. What is the lower limit of the class?
A)
6 done
clear
B)
7 done
clear
C)
8 done
clear
D)
12 done
clear
View Solution play_arrow
-
question_answer28)
In a frequency distribution, ogives are graphical representation of which of the following?
A)
Frequency done
clear
B)
Relative frequency done
clear
C)
Cumulative frequency done
clear
D)
Raw data done
clear
View Solution play_arrow
-
question_answer29)
Apart from plotting frequencies of the class intervals, which of the following are used to construct a frequency polygon?
A)
Upper limits of the classes done
clear
B)
Lower limits of the classes done
clear
C)
Any values of the classes done
clear
D)
Mid values of the classes done
clear
View Solution play_arrow
-
question_answer30)
The mean wage of 150 labourers working in a factory running three shifts with 60, 40 and 50 labourers is Rs. 114. The mean wage of 60 labourers working in the first shift is Rs. 121.50 and that of 40 labourers working the second shift is Rs. 107.75. Find the mean wage of those who are working in the third shift.
A)
Rs. 110 done
clear
B)
Rs. 100 done
clear
C)
Rs. 120 done
clear
D)
Rs. 115.75 done
clear
View Solution play_arrow
-
question_answer31)
The mean of n observations is\[\overrightarrow{X}.\]If each observation is multiplied by k. what is the mean of new observations?
A)
\[k\,\bar{X}\] done
clear
B)
\[\,\bar{X}\] done
clear
C)
\[\,\bar{X}+k\] done
clear
D)
\[\,\bar{X}-k\] done
clear
View Solution play_arrow
-
question_answer32)
The mean of 75 numbers is 25. If each number is divided by 5, find the new mean.
A)
5 done
clear
B)
20 done
clear
C)
8 done
clear
D)
15 done
clear
View Solution play_arrow
-
question_answer33)
For which set of numbers do the mean, median and mode have the same value?
A)
2,2,2,4 done
clear
B)
1, 3, 3, 3, 5 done
clear
C)
1, 1, 2, 5, 6 done
clear
D)
1, 1, 1, 2, 5 done
clear
View Solution play_arrow
-
question_answer34)
Find the difference between arithmetic means of all even and odd numbers between 50 and 60.
A)
2 done
clear
B)
0 done
clear
C)
1 done
clear
D)
3 done
clear
View Solution play_arrow
-
question_answer35)
For the set of numbers 2, 2, 4, 5 and 12 which of the following statements is true?
A)
Mean = Median done
clear
B)
Mean > Mode done
clear
C)
Mean < Mode done
clear
D)
Mode = Median done
clear
View Solution play_arrow
-
question_answer36)
A cricketer has a mean score of 60 runs in ten innings. Find the number of runs that are to be scored in the eleventh inning to raise the mean score to 62.
A)
62 done
clear
B)
78 done
clear
C)
58 done
clear
D)
82 done
clear
View Solution play_arrow
-
question_answer37)
Which of the following is the empirical relation between mean, mode and median?
A)
Mode = 3 Median - 2 Mean done
clear
B)
Mode = 2 Median - 3 Mean done
clear
C)
Median = 3 Mode - 2 Mean done
clear
D)
Mean = 3 Median - 2 Mode done
clear
View Solution play_arrow
-
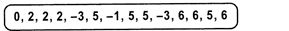
question_answer38)
Find the median of the data given.
A)
0 done
clear
B)
-1.5 done
clear
C)
2 done
clear
D)
3.5 done
clear
View Solution play_arrow
-
question_answer39)
The mean of 20 numbers is 40. If 5 is subtracted from every number, what will be the new mean?
A)
45 done
clear
B)
40 done
clear
C)
20 done
clear
D)
35 done
clear
View Solution play_arrow
-
question_answer40)
The mean of a, b, c, d and e is 28. If the mean of a, c, and e is 24, what is the mean of b and d?
A)
31 done
clear
B)
32 done
clear
C)
33 done
clear
D)
34 done
clear
View Solution play_arrow
-
question_answer41)
What is the algebraic sum of the deviations of a set of n values from their mean?
A)
0 done
clear
B)
n-1 done
clear
C)
n done
clear
D)
n+1 done
clear
View Solution play_arrow
-
question_answer42)
The mean of 50 observations was 250. It was detected on checking that the value of 165 was wrongly copied as 115 for computation of mean. Find the correct mean.
A)
215 done
clear
B)
151 done
clear
C)
156 done
clear
D)
251 done
clear
View Solution play_arrow
-
question_answer43)
The mean of the data \[{{x}_{1}},{{x}_{2}},{{x}_{3}},....{{x}_{n}}\]is 'a' Find the mean of the data\[{{x}_{1}}+{{\alpha }_{1}},{{x}_{2}}+\alpha ,{{x}_{3}}+\alpha ,...,{{x}_{n}}+\alpha \]
A)
\[a+\alpha \] done
clear
B)
\[a\,\alpha \] done
clear
C)
\[a+\,\alpha \] done
clear
D)
\[a-\,\alpha \] done
clear
View Solution play_arrow
-
question_answer44)
If the mean of 9 observations p, p + 2, p+4,p+6,p+8,p-2,p-4,p-6 and p 8 is 10. Find the mean of the least 5 observations.
A)
6 done
clear
B)
25 done
clear
C)
10 done
clear
D)
9 done
clear
View Solution play_arrow
-
question_answer45)
The median of the data 26, 56, 32, 33, 60, 17, 34, 29, 45, is 33. If 26 is replaced with 62, what is the new median?
A)
34 done
clear
B)
29 done
clear
C)
32 done
clear
D)
33 done
clear
View Solution play_arrow
-
question_answer46)
The mean of 6 numbers is 20. If one number is deleted, their mean is 15. Find the deleted number.
A)
45 done
clear
B)
52 done
clear
C)
20 done
clear
D)
36 done
clear
View Solution play_arrow
-
question_answer47)
The number of children in 10 families of a locality are 1, 4, 3, 3, 4, 2, 2, 3, 3 and 5. Find the mean number of children per family.
A)
3 done
clear
B)
4 done
clear
C)
1 done
clear
D)
2 done
clear
View Solution play_arrow
-
question_answer48)
The mean of some observations is 50. If their sum is 600, what is the number of observations?
A)
8 done
clear
B)
12 done
clear
C)
16 done
clear
D)
10 done
clear
View Solution play_arrow
-
question_answer49)
P Find the class mark of the class 90 -120.
A)
90 done
clear
B)
105 done
clear
C)
115 done
clear
D)
120 done
clear
View Solution play_arrow
-
question_answer50)
If the mean of the given data is 5.3, find the missing frequency 'p'.
| \[x\] | 4 | 8 | 6 | 7 |
| \[f\] | 11 | 2 | 3 | p |
A)
1.7 done
clear
B)
3 done
clear
C)
6.8 done
clear
D)
4 done
clear
View Solution play_arrow


