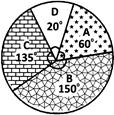
8th Class Mathematics Data Handling Question Bank Data Handling

  • question_answer
    The table shows the frequency distribution of grades obtained by 120 students. The data is represented in the following pie chart.
    Grade A B C D
    Frequency 20 50 45 5
    Which sector is labelled incorrectly?

    A)  A                                           

    B)                         B                                           

    C)                         C                                           

    D)                         D

    Correct Answer: D

    Solution :

    Not Available


You need to login to perform this action.
You will be redirected in 3 sec spinner