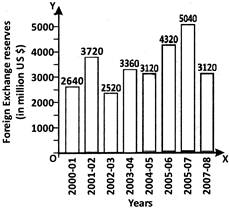
 Answer the questions based on the graph. What is the ratio of the number of years, in which the foreign exchange reserves are above the average reserves, to those in which the reserves are below the average reserves?
A) \[2:6\]
B) \[3:4\]
C) \[3:5\]
D) \[5:3\]
Correct Answer: C
Solution :
The average foreign exchange reserves over the given period = 3480 millions. The country had reserves above 3480 millions during the years \[2001-2002,\text{ }2005-2006,\text{ }2006-2007\]i.e., for 3 years and below 3480 millions during the years \[2000-2001,\text{ }2002-2003,\text{ }2003-2004,\] \[2004-2005\]and \[2007-2008\]i.e., for 5 years. Hence, the required ratio \[=3:5\]


You need to login to perform this action.
You will be redirected in
3 sec

