8th Class Mathematics Introduction to Graphs Question Bank Introduction to Graphs

  • question_answer
    Direction: The following line graph gives the ratio of the amount of imports by a company to the amount of exports from that company over the period from 2002 to 2008. Ratio of value of imports to exports by a company over the years. 
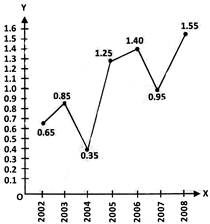
In which year was the imports minimum, proportionate to the exports of the company?

    A)  \[2002\]                             

    B)  \[2003\]             

    C)         \[2004\]             

    D)         \[2005\]

    Correct Answer: C

    Solution :

    Not Available


You need to login to perform this action.
You will be redirected in 3 sec spinner