-
question_answer1)
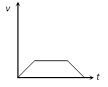
The variation of velocity of a particle with time moving along a straight line is illustrated in the following figure. The distance travelled by the particle in four seconds is [NCERT 1973]

A)
60 \[m\] done
clear
B)
55 \[m\] done
clear
C)
25 \[m\] done
clear
D)
30 \[m\] done
clear
View Solution play_arrow
-
question_answer2)
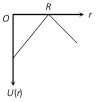
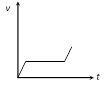
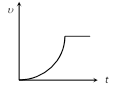
The displacement of a particle as a function of time is shown in the figure. The figure shows that [CPMT 1970, 86]

A)
The particle starts with certain velocity but the motion is retarded and finally the particle stops done
clear
B)
The velocity of the particle is constant throughout done
clear
C)
The acceleration of the particle is constant throughout. done
clear
D)
The particle starts with constant velocity, then motion is accelerated and finally the particle moves with another constant velocity done
clear
View Solution play_arrow
-
question_answer3)
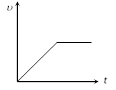
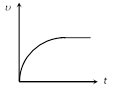
A ball is thrown vertically upwards. Which of the following graph/graphs represent velocity-time graph of the ball during its flight (air resistance is neglected) [CPMT 1993; AMU (Engg.) 2000] (A)

(B)

(C)

(d)

A)
A done
clear
B)
B done
clear
C)
C done
clear
D)
D done
clear
View Solution play_arrow
-
question_answer4)
The graph between the displacement \[x\] and time \[t\] for a particle moving in a straight line is shown in figure. During the interval \[OA,\,AB,\,BC\] and \[t=1,\ {{v}_{x}}=0\], the acceleration of the particle is [CPMT 1986]

A)
B)
C)
D)
View Solution play_arrow
-
question_answer5)
The \[v-t\] graph of a moving object is given in figure. The maximum acceleration is [NCERT 1972]
A)
\[1cm/\sec {{c}^{2}}\] done
clear
B)
\[2cm/{{\sec }^{2}}\] done
clear
C)
\[3\,\,cm/{{\sec }^{2}}\] done
clear
D)
\[6\,\,cm/{{\sec }^{2}}\] done
clear
View Solution play_arrow
-
question_answer6)
The displacement versus time graph for a body moving in a straight line is shown in figure. Which of the following regions represents the motion when no force is acting on the body [NCERT 1971]
A)
\[ab\] done
clear
B)
\[bc\] done
clear
C)
\[=1204\ m\] done
clear
D)
\[de\] done
clear
View Solution play_arrow
-
question_answer7)
The \[x-t\] graph shown in figure represents [CPMT 1984]
A)
Constant velocity done
clear
B)
Velocity of the body is continuously changing done
clear
C)
Instantaneous velocity done
clear
D)
The body travels with constant speed upto time \[{{t}_{1}}\] and then stops done
clear
View Solution play_arrow
-
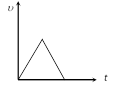
question_answer8)
A lift is going up. The variation in the speed of the lift is as given in the graph. What is the height to which the lift takes the passengers [IIT 1970]
A)
3.6 \[m\] done
clear
B)
28.8 \[m\] done
clear
C)
36.0 \[m\] done
clear
D)
Cannot be calculated from the above graph done
clear
View Solution play_arrow
-
question_answer9)
The velocity-time graph of a body moving in a straight line is shown in the figure. The displacement and distance travelled by the body in 6 sec are respectively [MP PET 1994]
A)
8 m, 16 m done
clear
B)
16 m, 8 m done
clear
C)
16 m, 16 m done
clear
D)
8 m, 8 m done
clear
View Solution play_arrow
-
question_answer10)
Velocity-time (v-t) graph for a moving object is shown in the figure. Total displacement of the object during the time interval when there is non-zero acceleration and retardation is [Kerala PMT 2005]
A)
60 m done
clear
B)
50 m done
clear
C)
30 m done
clear
D)
40 m done
clear
View Solution play_arrow
-
question_answer11)
Figures (i) and (ii) below show the displacement-time graphs of two particles moving along the x-axis. We can say that [Kurukshetra CEE 1996]
A)
Both the particles are having a uniformly accelerated motion done
clear
B)
Both the particles are having a uniformly retarded motion done
clear
C)
Particle (i) is having a uniformly accelerated motion while particle (ii) is having a uniformly retarded motion done
clear
D)
Particle (i) is having a uniformly retarded motion while particle (ii) is having a uniformly accelerated motion done
clear
View Solution play_arrow
-
question_answer12)
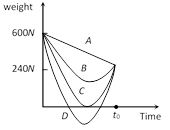
For the velocity-time graph shown in figure below the distance covered by the body in last two seconds of its motion is what fraction of the total distance covered by it in all the seven seconds [MP PMT/PET 1998; RPET 2001]
A)
\[\frac{1}{2}\] done
clear
B)
\[\frac{1}{4}\] done
clear
C)
\[\frac{1}{3}\] done
clear
D)
\[\frac{2}{3}\] done
clear
View Solution play_arrow
-
question_answer13)
In the following graph, distance travelled by the body in metres is [EAMCET 1994]
A)
200 done
clear
B)
250 done
clear
C)
300 done
clear
D)
400 done
clear
View Solution play_arrow
-
question_answer14)
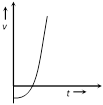
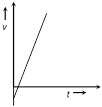
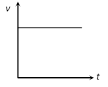
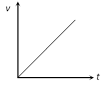
Velocity-time curve for a body projected vertically upwards is [EAMCET (Med.) 1995; AIIMS 1999; Pb. PMT 2004; BHU 2004]
A)
Parabola done
clear
B)
Ellipse done
clear
C)
Hyperbola done
clear
D)
Straight line done
clear
View Solution play_arrow
-
question_answer15)
The displacement-time graph of moving particle is shown below The instantaneous velocity of the particle is negative at the point [CBSE PMT 1994]
A)
D done
clear
B)
F done
clear
C)
C done
clear
D)
E done
clear
View Solution play_arrow
-
question_answer16)
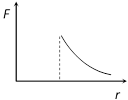
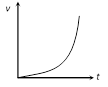
An object is moving with a uniform acceleration which is parallel to its instantaneous direction of motion. The displacement \[(s)-\]velocity (v) graph of this object is [SCRA 1998; DCE 2000; AIIMS 2003; Orissa PMT 2004]
A)
B)
C)
D)
View Solution play_arrow
-
question_answer17)
Which of the following graph represents uniform motion [DCE 1999]
A)
B)
C)
D)
View Solution play_arrow
-
question_answer18)
A ball is dropped vertically from a height \[d\] above the ground. It hits the ground and bounces up vertically to a height \[d/2\]. Neglecting subsequent motion and air resistance, its velocity \[v\] varies with the height \[h\] above the ground is [IIT-JEE Screening 2000]
A)
B)
C)
D)
View Solution play_arrow
-
question_answer19)
The graph of displacement v/s time is
Its corresponding velocity-time graph will be [DCE 2001]
A)
B)
C)
D)
View Solution play_arrow
-
question_answer20)
A train moves from one station to another in 2 hours? time. Its speed-time graph during this motion is shown in the figure. The maximum acceleration during the journey is [Kerala PET 2002]
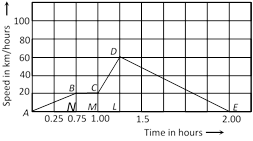
A)
\[140km\text{ }{{h}^{2}}\] done
clear
B)
\[160km\text{ }{{h}^{2}}\] done
clear
C)
\[100km\text{ }{{h}^{2}}\] done
clear
D)
\[120km\text{ }{{h}^{2}}\] done
clear
View Solution play_arrow
-
question_answer21)
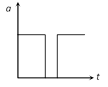
The area under acceleration-time graph gives [Kerala PET 2005]
A)
Distance travelled done
clear
B)
Change in acceleration done
clear
C)
Force acting done
clear
D)
Change in velocity done
clear
View Solution play_arrow
-
question_answer22)
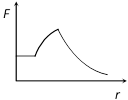
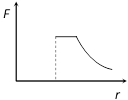
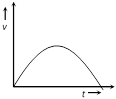
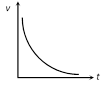
A ball is thrown vertically upwards. Which of the following plots represents the speed-time graph of the ball during its height if the air resistance is not ignored [AIIMS 2003]
A)
B)
C)
D)
View Solution play_arrow
-
question_answer23)
Which graph represents the uniform acceleration [DCE 2003]
A)
B)
C)
D)
View Solution play_arrow
-
question_answer24)
Which of the following velocity-time graphs shows a realistic situation for a body in motion [AIIMS 2004]
A)
B)
C)
D)
View Solution play_arrow
-
question_answer25)
Which of the following velocity-time graphs represent uniform motion [Kerala PMT 2004]
A)
B)
C)
D)
View Solution play_arrow
-
question_answer26)
Acceleration-time graph of a body is shown. The corresponding velocity-time graph of the same body is [DPMT 2004]
A)
B)
C)
D)
View Solution play_arrow
-
question_answer27)
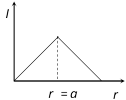
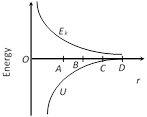
The given graph shows the variation of velocity with displacement. Which one of the graph given below correctly represents the variation of acceleration with displacement [IIT-JEE (Screening) 2005]
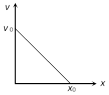
A)
B)
C)
D)
View Solution play_arrow
-
question_answer28)
The acceleration-time graph of a body is shown below
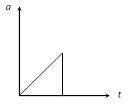
The most probable velocity-time graph of the body is
A)
B)
C)
D)
View Solution play_arrow
-
question_answer29)
From the following displacement-time graph find out the velocity of a moving body
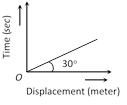
A)
\[\frac{1}{\sqrt{3}}\] m/s done
clear
B)
3 m/s done
clear
C)
\[\sqrt{3}\] m/s done
clear
D)
\[\frac{1}{3}\] done
clear
View Solution play_arrow
-
question_answer30)
The \[\upsilon -t\] plot of a moving object is shown in the figure. The average velocity of the object during the first 10 seconds is
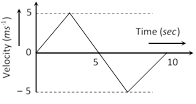
A)
0 done
clear
B)
\[2.5m{{s}^{1}}\] done
clear
C)
\[5m{{s}^{1}}\] done
clear
D)
\[2m{{s}^{1}}\] done
clear
View Solution play_arrow
 done
clear
done
clear
 done
clear
done
clear
 done
clear
done
clear
 done
clear
done
clear
 done
clear
done
clear
 done
clear
done
clear
 done
clear
done
clear
 done
clear
done
clear
 done
clear
done
clear
 done
clear
done
clear
 done
clear
done
clear
 done
clear
done
clear
 done
clear
done
clear
 done
clear
done
clear
 done
clear
done
clear
 done
clear
done
clear
 done
clear
done
clear
 done
clear
done
clear
 done
clear
done
clear
 done
clear
done
clear
 done
clear
done
clear
 done
clear
done
clear
 done
clear
done
clear
 done
clear
done
clear
 done
clear
done
clear
 done
clear
done
clear
 done
clear
done
clear
 done
clear
done
clear
 done
clear
done
clear
 done
clear
done
clear
 done
clear
done
clear
 done
clear
done
clear
 done
clear
done
clear
 done
clear
done
clear
 done
clear
done
clear
 done
clear
done
clear
 done
clear
done
clear
 done
clear
done
clear
 done
clear
done
clear
 done
clear
done
clear
 done
clear
done
clear
 done
clear
done
clear
 done
clear
done
clear
 done
clear
done
clear


