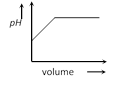
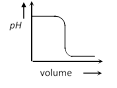
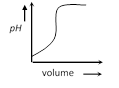
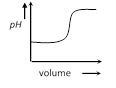
JEE Main & Advanced Chemistry Analytical Chemistry Question Bank Volumetric Analysis

  • question_answer
    Which of the following plot represents the graph of pH against volume of alkali added in the titration of NaOH and HCl [Orrisa JEE 2002]

    A)

    B)

    C)

    D)

    Correct Answer: C

    Solution :


You need to login to perform this action.
You will be redirected in 3 sec spinner