A)
B)
C)
D)
Correct Answer: D
Solution :
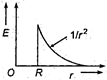
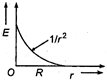
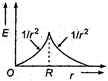
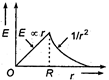
The electric field intensity at a point lying outside the sphere (non-conducting) is \[E=\frac{1}{4\pi {{\varepsilon }_{0}}}\frac{q}{{{r}^{2}}}\] where r is the distance of that point from centre of sphere. \[\therefore \] \[E\propto \frac{1}{{{r}^{2}}}\] ... (i) The electric field intensity at surface of sphere \[E=\frac{q}{4\pi {{\varepsilon }_{0}}{{R}^{2}}}\] or \[E\propto \frac{1}{{{R}^{2}}}\] ... (ii) R, being the radius of sphere. The electric field intensity at a point lying inside the sphere is \[E=\frac{qr}{4\pi {{\varepsilon }_{0}}{{R}^{3}}}\] or \[E\propto r\] ... (iii) Also at the centre of sphere r = 0. Hence, E = 0. The graphical distribution is shown below: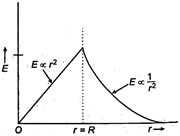


You need to login to perform this action.
You will be redirected in
3 sec

