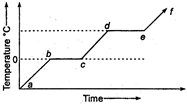
 Which parts of the above plot represent a phase change?
A) a to b and e to \[f\]
B) btocandctod
C) d to e and e to \[f\]
D) b to c and d to e
Correct Answer: D
Solution :
At \[{{0}^{o}}C\] from b to c, temperature of matter does not change but its state changes. Similarly, from d to e state of matter changes without changing temperature. Hence, b to c and d to e show phase changes.


You need to login to perform this action.
You will be redirected in
3 sec

