A)

B)

C)

D)

Correct Answer: C
Solution :
The variation of potential energy (U) with distance (x) is \[U=\frac{1}{2}k{{x}^{2}}\]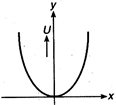 Hence, parabolic graph is obtained.


You need to login to perform this action.
You will be redirected in
3 sec

