A) isochoric process
B) isothermal process
C) isobaric process
D) adiabatic process
Correct Answer: D
Solution :
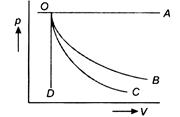
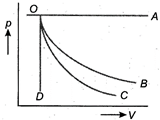 (i) Curve OA represents isobaric process (since pressure is constant) Since, the slope of adiabatic process is more steeper than the isothermal process. (ii) Curve OB represents isothermal process. (iii) Curve OC represents adiabatic process. (iv) Curve OD represents isochoric process (since volume is constant).


You need to login to perform this action.
You will be redirected in
3 sec

