A)

B)

C)

D)

Correct Answer: B
Solution :
Moseley studied the X-ray spectra of various elements. The spectral line observed were of short wavelength - K series and (ii) long wavelength-L series. \[{{K}_{\alpha }}\] line is most intense in the K-series. Moreover, he observed that the wavelength of the \[{{K}_{\alpha }}\] line decreases with increase in the atomic number of the element as the target. If a graph is plotted between the square root of the frequency and the atomic number| of the element emitting the line, it is a straight line Thus, \[\sqrt{f}\propto Z\] Where \[\sqrt{f}\] is the frequency of the radiation and Z is the atomic number of the element.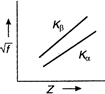


You need to login to perform this action.
You will be redirected in
3 sec

