Category : 12th Class
Population growth refers to the increase in its size. It is determined by the number of individuals added to the population and the number of individuals lost from the population. Addition occurs by births and immigration. Loss results from deaths and emigration. If more individuals are added than are lost i.e., the vital index is more than 100, the population will increase or show positive growth. If more individuals are lost than are added i.e., the vital index is less than 100, the population will decrease or show negative growth. If addition and loss are balanced, i.e., the vital index is 100, the population will become stationary or show zero growth.
Malthus Theory of Human Population Growth : Thomas Malthus, a British political economist, put forward a theory of human population growth in 1778. Malthus in his "Essay on the principle of population" pointed out that population tends to increase in geometric progression while food supply increase only in arithmetic progression. Faster growth of population than of its requirements causes an imbalance between the two. When this imbalance reaches a certain limit, environmental factors like famine, epidemic of a disease, earth quake, flood, war etc reduce the population to a size, the available resources can support. The factors that control the population size were called positive checks by Malthus.
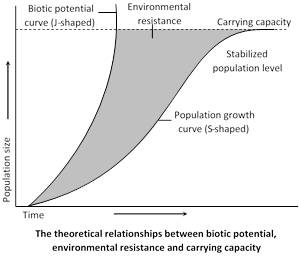
Natural Control of Population Growth : Growth of a population is controlled by an interaction between three factors: biotic potential, environmental resistance and carrying capacity of environment.
(1) Biotic or reproductive potential : Biotic potential is the natural capacity of a population to increase at its maximum rate under ideal environmental conditions and stable age and sex ratios. The biotic potential for all animals is very high. If unchecked, the numbers of any species will quickly over run the world. Biotic potential in the human female is estimated to be about 12 per female during its reproductive period between the puberty and the menopause period.
(2) Environmental Resistance : In nature full biotic potential of an organism or population is never realized, since conditions are rarely ideal. Various harmful environmental (abiotic) factors like non-availability of food and shelter, natural calamities like drought, cloud bursts, floods, fires, temperature fluctuations, accidents, etc. and certain biotic factors like pathogens, parasites, predators etc. check the biotic potential from being realized. The sum of all these inhibitory factors is called environmental resistance.
(3) Carrying capacity : It is defined as “Feeding capacity of an environment of an ecosystem for a population of a species under provided set of conditions”. When a population reaches the carrying capacity of its environment, the population has zero growth rate. So the population generally stabilizes around the carrying capacity. The carrying capacity of the earth for human population is considered to be about 8 to15 billions. Carrying capacity of the environment for a population depends upon three major components :
(i) Productive systems which produce food and fibre e.g. croplands, orchards, etc.
(ii) Protective systems which buffer air and water cycles and keep moderate environmental temperatures e.g. ocean etc.
(iii) Assimilative systems which utilize the wastes produced by human activities e.g. waterways, wetlands, etc.
Productive system and protective systems collectively form the life-supporting capacity, while assimilative systems collectively form the waste assimilative capacity.
(iv) Population fluctuations and population cycles : The populations are not stable and do change due to a number of extrinsic as well as intrinsic factors. These variation in the population size are of two types :
(a) Population fluctuations or irruptive variations : In these changes, population density tends to fluctuate irregularly above and below some steady-state level. These are characterized by sudden increase in population in short time which is followed by equally quick decrease in population size. These are caused by random seasonal or annual changes in availability of resources (food or energy) or extrinsic factor (e.g., temperature, rainfall etc.) e.g., more birds during early summer due to their hatching period, more insects during summer months and more weeds in rainy season.
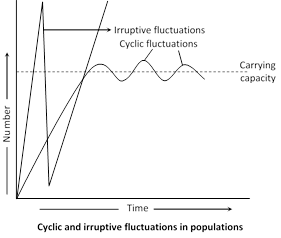
(b) Population cycles : These are regular changes in the population size. In these, population size is nearly constant over long period of time. These are caused by seasonal changes in environment e.g. population cycles (of 3 to 4 years) of lemmings of Tundras (Elton, 1942) Lemmings (Lemmus lemmus) (small mouse-like rodents found in arctic regions of Canada and Norway) increase in their number for a period of about 3 years when it reaches a peak beyond the carrying capacity of that area. They eat up all the available food. In the winter months, the lemmings migrate in large numbers in the sea and swim till they are drowned due to exhaustion. The surviving lemmings multiply and repeat the process.
Patterns of Population Growth : Growth of a population can be expressed by a mathematical expression, called growth curve in which logarithm of total number of individuals in a population is plotted against the time factor. Growth curves represent interaction between biotic potential and the environmental resistance.
Two basic types of growth curves
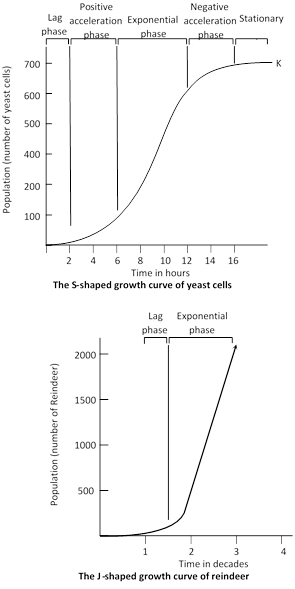
(i) Sigmoid or S-shaped growth curve : It is shown by yeast cells and most of organisms. It is formed of five phases :
(a) Lag phase. In which the individuals adapt themselves to the new environment, so there is no or very little increase in population.
(b) Positive Acceleration phase. It is the period of slow increase in population in the beginning.
(c) Logarithmic or Exponential phase : It is the period of rapid rise in population due to availability of food and requirements of life in plenty and there being no competition.
(d) Negative Acceleration phase : In which again there is slow rise in population as the environmental resistance increases.
(e) Stationary (Plateau) phase : Finally, growth rate becomes stable because mortality and natality rates become equal to each other. So there is zero growth rate. A stable population is said to be in equilibrium, or at saturation level. This limit in population is a constant K and is imposed by the carrying capacity of the environment. S-shaped curve is also called logistic curve. Sigmoid growth curve was described by Verhulst, (1839)
(ii) J-shaped Growth curve : It is shown by small population of Reindeer experimentally reared in a natural environment with plenty of food but no predators. It has only two phases:
(a) Lag phase : It is period of adaptation of animals to new environment so is characterized by slow or no growth in population.
(b) Logarithmic or Exponential phase : It is characterized by rapid growth in population which continues till enough food is available. But with the increase in reindeer population, there is corresponding decrease in the availability of food and space, which finally become exhausted, which leads to mass starvation and mortality. This sudden increase in mortality is called population crash. Lemming of Tundra, some insect, algal blooms and annual plants also show J-shaped curves. The population growth curve is S- shaped in most of the organisms, Human population also shows S-shaped curve.
Difference between S-shaped and J-shaped Growth curves
|
S.No. |
S-shaped Growth Curve |
J-shaped Growth Curve |
|
(1) |
It is formed of 5 phases : lag phase, positive acceleration phase, exponential phase, negative acceleration phase and stationary phase. |
It is formed of 2 phases : lag phase and exponential phase. |
|
(2) |
Finally the population shows zero growth rate as birth rate equals death rate. |
Finally, the population shows a population crash due to rapid increase in mortality rate. |
|
(3) |
Examples. Yeast cells in a culture medium. |
Examples. Reindeers, algae blooms, lemmings of Tundras |
(iii) Human Population Growth Curve : The modern man (Homo sapiens sapiens) appeared about 25,000 years ago. For a very long time, the human population remained in the lag phase, having little or very slow growth. By the year 1 A.D., there were about 0.25 billion people in the world, and by 1600 about 0.5 billion. Thus, it took 1600 years for the population to become double. The exponential phase of growth of the human population started about 1750. Since then, the time taken by the population to become double has considerably shortened. It doubled in 200 years \[(1600-1800\text{ }A.D.),\] becoming 1 billion; then doubled in 130 years \[(1800-1930\text{ }A.D.),\] growing to 2 billion; then doubled in only 45 years \[(1930-1975\text{ }A.D.),\] reaching about 4 billion. At present, the world human population grows at a rate of 2 percent a year, and it has now reached 6 billion. If the present growth rate persists, there would be 8 billion people on earth by the year 2017.
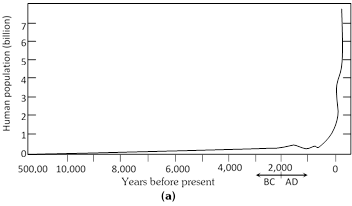
World population gain is 2 persons every second; 200,000 people every day; 8 million every month; and 70 million every year. The high rate of growth is often referred to as “population explosion” The word “explosion” may be defined as a rapid and expansive change of state.
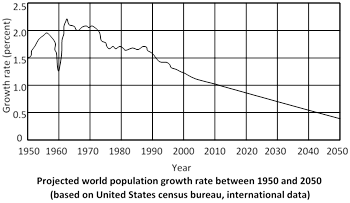
The future of human population is difficult to predict. It may stabilize and have S-shaped growth curve or decline rapidly and have J-shaped growth curve. The population will stabilize if the birth and death rates are balanced in the near future. It will rapidly decline if it overgrows the carrying capacity of the environment.


You need to login to perform this action.
You will be redirected in
3 sec

