Linear Equations in One VariableFUNDAMENTAL
In the GMO Class VII Excellence Book, Chapter 4, we had learnt about linear equations and their solutions. However, we will review these facts again and also take up new types of linear equations.
Equation: An equation is a statement of equality of two algebraic expressions involving one or more unknown quantities called variables.
An equation involving only linear polynomials is called a linear equation.
Some example of linear equations are given below:
(i) \[2x-3=6-2x\] (ii) \[2\left( y-3 \right)=10\]
(iii) \[\frac{7}{3}m=14\] (iv) \[91z=182\]
Rules for solving a linear equation
(i) We can add the same number on both sides of the equation.
For e.g., We can add 3 on both sides of \[2x-3=6-2x\] (See examples above) to get \[2x=9-2x\]
(ii) We can subtract the same number from both sides of the equation. .
For e.g., We can subtract 10 from both sides of \[2(y-3)=10\] (See examples above) to get
\[2\left( y-3 \right)-10=10-10\] or, \[2y-6-10=0\] or, \[2y-16=0\]
(iii) We can multiply both sides of the equation by the same nonzero number.
For e.g.. We can multiply both sides of \[\frac{7}{3}m=14\] by \[\frac{7}{3}\] to get, \[\frac{7}{3}m\times \frac{7}{3}=14\times \frac{7}{3}\]
or, m = 6
(iv) We can divide both sides of the equation by the same non-zero number.
For e.g., we can divide both sides by \[91z=182\] by 91 to get z = 2
(v) if \[\frac{ax+b}{cx+d}=\frac{m}{n}\] then n (ax +b)= m(cx +d).
(by cross-multiplication)
(vi) Transposition: when a term of an equation is taken to the other side, its sign gets changed..
This process is known as transposition.
Examples:
(i) \[7x+3=4x+5\Rightarrow 7x-4x=5-3\]
(Transporting by adding or subtracting)
(ii) \[6xyz=7{{x}^{2}}\Rightarrow yz=\frac{7{{x}^{2}}}{6x}=\frac{7x}{6}\]
(Transportation by multiplying or dividing)
Elementary question-1
Solve: \[10x=5x+25\]
Solution: \[10x=5x+25\Rightarrow 10x-5x=25\Rightarrow 5x=25\Rightarrow x=\frac{25}{5}=5\]
Elementary question-2
Solve: \[\frac{5y}{6}-1=\frac{7}{3}\]
Solution: \[\frac{5y}{6}-1=\frac{7}{3}\Rightarrow \frac{5y}{6}=\frac{7}{3}+1\Rightarrow \frac{5y}{6}=\frac{10}{3}\Rightarrow y=\frac{10}{3}\times \frac{6}{5}=4\]
Elementary question-3
Solution: \[\frac{a+5}{3}+\frac{a+6}{5}=\frac{2a+3}{4}\]
Multiplying throughout by LCM of 3, 4, 5 (LCM = 60),
We get, \[20\left( a+5 \right)+12\left( a-6 \right)=15\left( 2a+3 \right)\]
\[\Rightarrow 20a+100+12a-72=30a+45\]
\[\Rightarrow \left( 20a+12a-30a \right)=\left( 45-100+72 \right)\]
\[\Rightarrow 2a=17\Rightarrow a=\frac{17}{2}\]
Elementary question 4
Solve: \[\frac{2x+3}{3x-1}=\frac{1}{2}\]
Solution: By cross - multiplying, we get,
\[4x+6=3x-1\Rightarrow \left( 4x-3x \right)=-1-6\Rightarrow x=-7\]
Elementary question 5
Solve: \[\frac{5x-4}{2x-7}=\frac{10x+3}{4x-7}\]
Solution: Cross-Multiplying,
\[\left( 5x-4 \right)\left( 4x-7 \right)=\left( 2x-7 \right)\left( 10x+3 \right)\]
\[\Rightarrow \mathbf{20}{{\mathbf{x}}^{\mathbf{2}}}-\mathbf{16x}-35x+28=\mathbf{20}{{\mathbf{x}}^{\mathbf{2}}}-\mathbf{70x}+\mathbf{6x}-21\]\[\Rightarrow -51x+28=-64x-21\]
\[\Rightarrow -51x+64x=-21-28\]
\[\Rightarrow \]\[13x=-49\Rightarrow x=\frac{-49}{13}\]
Application Based Questions for Concept-Building
Given that two numbers are in the ratio 2:3. If the difference of number is 17, find the numbers.
Ans. You should carefully think about the wording of question for a while. Rather than choosing numbers as x & y, you should choose them as \[2x\And 3x.\] Thus, ratio \[\frac{2x}{3x}=\frac{~2}{3}\]is maintained and it is easy to solve the problem. As given in question,
Difference \[=3x-2x=17\Rightarrow x=17\]
\[\therefore 2x=34\]and \[3x=51\] are the numbers.
The three digits of a three digit number is such that face value of first digit (at hundreds more...
QUADRILATERALSFUNDAMENTAL
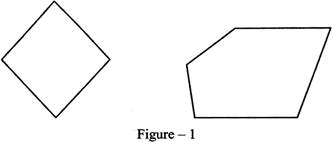
Polygons: A simple closed figure made up of line segments only, is known as a polygon.
Minimum no of sides in a polygon is three, which gives a triangle (a).
More than three sides of polygon are as follows:
4-sided figure = quadrilateral
5 -sided figure = pentagon
6-sided figure = hexagon and so on.
Type of polygons
Convex polygon: Polygon in which each angle is less than 180°
e.g.:
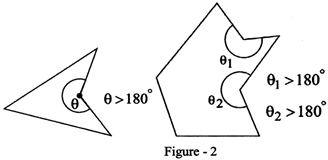
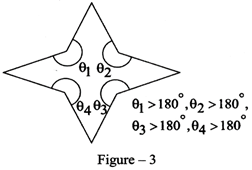
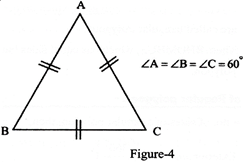
Concave Polygon : Polygon in which at least one angle is more than \[\mathbf{180}{}^\circ \]
e.g.:
According to another basis, polygons are classified as;
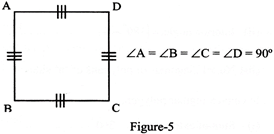
(i) Regular Polygons: Polygons in which all sides and all angles are equal, are called Regular Polygons. Specific names are given to each of them depending upon no of sides.
(a) In Triangles:
Equilateral \[\Delta \,1e\]
(b) In quadrilaterals: Square
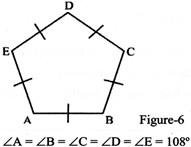
(c) In Pentagons: Regular pentagon
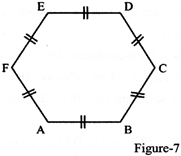
(d) In Hexagons: Regular hexagon
\[\angle A=\angle B=\angle C=\angle D=\angle E=\angle F={{120}^{{}^\circ }}\]& so on.
(ii) Irregular polygons: Polygons which do not nave equal sides or equal angles, are called Irregular Polygons.
Thus, RHOMBUS, which has equal sides but unequal angles, is irregular polygon.
Properties of Regular polygons:-
If n = no. of sides of a regular polygon, then,
(i) Exterior angle, \['\theta '=\left( \frac{{{360}^{{}^\circ }}}{n} \right)\]
(ii) Interior angle, = \[\left( {{180}^{{}^\circ }}-\theta \right)\]
(iii) No. of diagonals of polygons of 'n’ sides \[=\frac{n(n-2)}{2}\]
In convex regular polygon,
(i) Sum of exterior \[{{\angle }^{1e}}s={{360}^{{}^\circ }}\]
(ii) Sum of interior \[{{\angle }^{1e}}s=\left( \frac{n-2}{2} \right)*{{360}^{{}^\circ }}\]
Now, we shall concentrate our studies on quadrilaterals.
Quadrilaterals: On the basis of our knowledge of polygons, quadrilaterals are simple closed figures made up of four line segments. Another way to define quadrilateral is as follows:
Quadrilateral
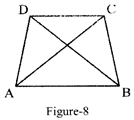
Let, A, B, C, D be four points in a plane. Let 3 or more points be not collinear. The figure formed by four line segments joining points A, B, C and D is called the quadrilateral ABCD.
For Example, look at the quadrilateral ABCD,
(i) the four points A, B, C, D are called its vertices,
(ii) The four line segments AB, BC, CD, and DA are called its sides,
(iii)\[\angle DAB,\angle ABC,\angle BCD,\]and\[\angle CDA\]are known as its angles
(iv) Line segments AC and BD are known as its diagonals.
Adjacent sides of a more...
A perfect square is a number that can be expressed as the product of two equal integers.
It is always expressible as the product of equal factors.
e.g., \[144=2\times 2\times 2\times 2\times 3\times 3={{4}^{2}}\times {{3}^{2}}={{(12)}^{2}}\]
\[81=3\times 3\times 3\times 3={{3}^{2}}\times {{3}^{2}}={{\left( 9 \right)}^{2}}\]
Example:- Show that 300 is not a perfect square.
Solution:- Resolving 300 into prime factors, we get \[300=2\times 2\times 5\times 5\times 3\]
Making pairs of equal factors, we find that the digit 3 is not forming a pair (i.e. it appears only once). Hence 300 is not a perfect square.
Properties of perfect squares
A number ending in 2, 3, 7 or 8 is never a perfect square
e.g., 82, 73, 177, 2888 etc.
A number ending in an odd number of zeros is never a perfect square.
e.g., 160, 4000, 900000 end in one zero, three zero, five zeros. So, none of them is a perfect square.
For every natural n, we have sum of the first n odd natural numbers \[={{n}^{2}}\]
e.g., (i) \[1+3+5+7+9={{\left( 5 \right)}^{2}}=25\]
(ii) \[1+3+5+7+9+11+13={{\left( 7 \right)}^{2}}=49\]
Between two consecutive square numbers n2 and\[{{(n+1)}^{2}}\], there are 2n non-perfect square numbers.
e.g., Let n = 1 n+1 = 2
(1)2, (2)2
2, 3 lie between (1)2 and (2)2
\[\Rightarrow \]2n = 2 non-perfect squares numbers between (1)2 and (2)2
Pythagorean Triplets
A triplet (m, n, p) of three natural number, (m, n and p) is called a Pythagoras triplet if \[{{m}^{2}}+{{n}^{2}}={{p}^{2}}.\]
e.g., \[\left( 3,4,5 \right),\left( 5,12,13 \right),\left( 8,15,17 \right)\]etc. are examples of Pythagoras triplets.
Some Shortcuts to find squares
Column Method:- This method is based upon an old Indian method of multiplying two numbers. It is convenient for finding squares of two digit numbers only. This method uses the identity \[{{(x+y)}^{2}}={{x}^{2}}+2xy+{{y}^{2}}\]
e.g., \[{{(52)}^{2}}=\]Let unit place 2 = y and tens place 5 = x
Then follow this Rule
more...
Cube:- If y is a non-zero number, then \[y\times y\times y\] written as y3 is called the cube of y or simply y cubed.
e.g.,
(i) \[{{\left( 5 \right)}^{3}}=5\times 5\times 5=125.\] Thus, Cube of 5 is 125.
(ii) \[{{\left( 9 \right)}^{3}}=9\times 9\times 9=729\]. Thus,
Perfect cube:- A natural number n is a perfect cube if it is the cube of some natural number.
Or
Natural number n is a perfect cube if there exists a natural number whose cube is n
i.e. \[n={{x}^{3}}\]
e.g.,(i) 343 is a perfect cube, because there is a natural number 7 such that
\[343=7\times 7\times 7={{7}^{3}}\]
e.g., (ii) \[{{4}^{3}}=4\times 4\times 4=64\]
\[{{5}^{3}}=5\times 5\times 5=125\]
\[{{9}^{3}}=9\times 9\times 9\times =723\]
Properties of perfect cube:
If 'n' is even, then \[{{n}^{3}}\] is also even.
If 'n' is odd, then \[{{n}^{3}}\] is also odd.
If 'm' is even and 'n’ is odd, then \[{{m}^{3}}\times {{n}^{3}}\]is even.
If a number's units place has digit 1, 4, 5, 6, then its Cube also ends in the same digit
Cube of negative number is negative
\[{{(-1)}^{3}}=-1,{{(-~9)}^{3}}=-729\]
Some Shortcuts to find cubes
Column method:- Let x = ab (where a is tens digit and b is units digit)
Be a 2 digit natural number.
Then \[{{(a+b)}^{3}}={{a}^{3}}+3{{a}^{2}}b+3a{{b}^{2}}+{{b}^{3}}\]
e.g.. Find the cube of 26 by using column method.
Solution:- By Using column method , we have
COMPARING QUANTITIES
FUNDAMENTALS
Ratio and Proportion
Ratio is method of comparing two quantities of the same kind by division.
A ratio does not have any unit, it is only a numerical value.
The symbol used to write a ratio is ':' and is read as 'is to
A ratio is generally expressed in its simplest form.
To express two terms in ratio, they should be in the same units of measurement.
Multiplying or dividing the terms of a ratio by the same number gives equivalent ratio.
When two ratios are equal, they are known to be in proportion. The symbol for proportion is ': :' and is read as 'as to'.
For e.g., 2 is to 3 as to 6 is to 9 is written as 2 : 3 : : 6 : 9 or, \[\frac{2}{3}=\frac{6}{9}\]
If two ratios are equal or are in proportion, then the product of means is equal to the product of their extremes.
Example: If a:b::c:d then the statement ad = bc, holds good.
If a : b and b : c are in proportion such that (symbol, |) \[{{b}^{2}}=ac\] then b is called the mean proportional of a : b and b : c.
Percentage
Another way of comparing quantities is percentage. The word percent means per Thus 13% means 13 parts out of 100 parts.
Fractions can be converted into percentages and vice versa.
e.g., (i)\[\frac{1}{5}=\frac{1}{5}\times 100%=20%\]
(ii) \[15%=\frac{15}{100}=\frac{3}{20}\]
Decimals can be converted into percentages and vice-versa.
e.g., (i) \[0.26\text{=}0.26\times 100%=26%\]
(ii) \[33%=\frac{33}{100}=0.33\]
If a number is increased by a%, and then decreased by a% or is decreased by a%, and then increased by a%, then the original number decreases by \[\frac{{{a}^{2}}}{100}%\]%.
Example: Express each of the following as a fraction:
(i) 18% (ii) 0.45% (iii) \[87\frac{1}{2}%\]
Solution: We have,
(i) \[18%=\frac{18}{100}=\frac{9}{50}\]
(ii) \[0.45%=\frac{0.45}{100}=\frac{45}{10000}=\frac{9}{2000}\]
(iii) \[87\frac{1}{2}%=\frac{87\frac{1}{2}%}{100}=\frac{7}{8}\]
(Dividing numerator &denominator by \[12\frac{1}{2}\] as \[12\frac{1}{2}\]is factor of both \[87\frac{1}{2}\]and 100, we get \[\frac{7}{8}\]). [It would help if you remember table of\[12\frac{1}{2}:12\frac{1}{2}\times 1=12\frac{1}{2};\]\[12\frac{1}{2}\times 2=25;...............12\frac{1}{2}\times 8=100]\]
Example: Which is smallest amongst \[\mathbf{8}\frac{1}{3}\text{ }\!\!%\!\!\text{ },\frac{2}{9}\mathbf{and}\text{ }\mathbf{0}.\mathbf{21}\] ?
Solution: We may write,
\[8\frac{1}{3}\text{ }\!\!%\!\!\text{ =}\frac{25}{3}%=\frac{25}{3}\times \frac{1}{100}=\frac{1}{12}=0.0833..\]
\[\frac{2}{9}=0.222...\] Clearly, \[8\frac{1}{3}%\]is the smallest
ALGEBRAIC EXPRESSION & IDENTITIES
FUNDAMENTALS
In our GMO Class VII, We have learnt about the addition and subtraction of algebraic expressions.
We will carry those ideas further.
Addition of Algebraic Expressions
While adding algebraic expressions, we collect the like terms and add them.
EXAMPLE 1. Add: \[\left( 2m+3n+59\text{ }and-n-p+6q+3m \right)\]
Solution: Writing the terms of the given expressions in the same order in form of rows with like terms below each other and adding column wise, we get:
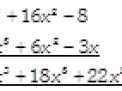
Example 2- Add: \[9{{x}^{3}}+6{{x}^{5}}-8+16{{x}^{2}}\] and \[10{{x}^{8}}6{{x}^{2}}+9{{x}^{3}}-3x\]
Solution: Writing the given expressions in descending powers of x in the form of rows with like terms below each other and adding column wise, we get:
Subtraction of Algebraic Expressions
Steps:
Arrange the terms of the given expression in the same order.
Write the given expressions in two rows in such a way that the like terms occur one below the other, keeping the expression to be subtracted in the second row.
Change the sign of each term in the lower row from + to - and/or, from - to +.
With new signs of the terms of lower row, add column wise.
EXAMPLE 4. Subtract \[3m+4n-5p{}^\circ \] from \[2n+8m{}^\circ +17p\]
Remember from chapter 6, Class VII, GMO that any number to the power zero is 1
\[\therefore p{}^\circ =1\]and \[m{}^\circ =1\Rightarrow 5p{}^\circ =5\]and \[8m{}^\circ =8\]
\[\therefore \] we have,
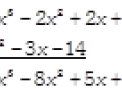
EXAMPLE 5: Subtract \[6{{x}^{2}}-3x-14\] from \[5+2x-2{{x}^{2}}+13{{x}^{3}}\]
Solution: Arranging the terms of the given expressions in descending powers of x and subtracting column wise, we get:
Multiplication of Algebraic Expressions
As we learnt in chapter 6, Class VII GMO Book,
The product of two factors with like signs is positive, and the product of two factors with unlike signs is negative.
If x is a variable and m, n are positive integers, then \[({{a}^{m}}\times {{a}^{n}})={{a}^{(m+n)}}.\]
Thus, \[{{2}^{3}}\times {{2}^{2}}={{2}^{5}}\]
Which you can ordinarily also verify as \[{{2}^{3}}=8;{{2}^{2}}=4;8\times 4=32={{2}^{5}}.\]
(a). Multiplication of Two Monomials
Remember, Product of two monomials = (product of their numerical coefficients) x (Product of their variable parts)
EXAMPLE-1: Find the product of:
(i) \[-7{{x}^{2}}yz\,and\,-6{{y}^{2}}zx\]
Solution:- \[-7{{x}^{2}}yz-(6{{y}^{2}}zx)\]
\[=\left\{ (-7)\times (-61) \right\}\times \left\{ {{x}^{2}}yz\times {{y}^{2}}zx \right\}\]
\[=\left\{ (-7)\times (-61) \right\}\times \left\{ {{x}^{2}}yz\times {{y}^{2}}zx \right\}\]
\[=42\times {{x}^{3}}{{y}^{3}}{{z}^{3}}\]
(b). Multiplication of a Polynomial by a Monomial
Multiple each term of the polynomial by the monomial, using the distributive law for multiplication over addition.
EXAMPLE-2 Find each of the following products:
(i) \[8{{a}^{3}}{{b}^{2}}\times \left( 6{{a}^{2}}-5ab+9{{b}^{2}} \right)\]
Solution: We have:
\[8{{a}^{3}}{{\text{b}}^{2}}\times \left( 6{{a}^{2}}-5ab+9{{b}^{2}} \right)\]
\[=\left( 8{{a}^{3}}{{b}^{2}} \right)\times \left( 6{{a}^{2}} \right)+\left( 8{{a}^{3}}{{b}^{2}} \right)\times \left( -5ab \right)+\left( 8{{a}^{3}}{{b}^{2}} \right)\times \left( 9{{b}^{2}} \right)\]
\[=48{{a}^{5}}{{\text{b}}^{2}}-40{{a}^{4}}{{b}^{3}}+72{{a}^{3}}{{b}^{4}}\]
(c). Multiplication of Two Binomials
Suppose (a + b) and (c + d) are two binomials. By using the distributive law of multiplication over addition twice, we may more...
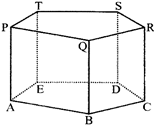
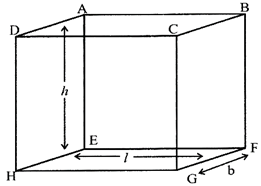
Cuboid:- A cuboid is a solid bounded by the rectangular plane regions. A cuboid has six faces, 12 edges and 8 vertices.
Total surface Area of the cuboid \[=2\left( lb+bh+hl \right)\] sq. units.
Volume of the cuboid \[={{l}^{2}}\times b\times h\]
Diagonal of the cuboid \[=\sqrt{{{l}^{2}}+{{b}^{2}}+{{h}^{2}}}\]
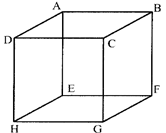
Cube:- A cuboid whose length, breadth and height are equal is called a cube.
If length of each edge of a cube is a.
Then, volume of the cube \[={{a}^{3}}\]
Total surface area of the cube \[=6{{a}^{2}}\]
Diagonal of the cube\[=\sqrt{3a}.\]
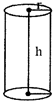
Cylinder:- It is formed by rotating one side of a rectangle about its opposite side.
Volume of the cylinder \[=\pi {{r}^{2}}h\]
Area of the base \[=\pi {{r}^{2}}\]
Area of the curved surface \[=2\pi rh\]
Total surface Area
\[=27\pi rh+2{{\pi }^{2}}h=2\pi r(h+r)\]
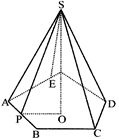
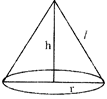
Right Circular Cone:- A right circular cone is a solid generated by rotating a right angled triangle around its height.
Radius = r, Height = h
Slant height = l
Volume of the cone \[\frac{1}{3}=\pi {{r}^{2}}h\]
Area of the Base \[=\pi {{r}^{2}}\]
Area of the curved surface \[=\pi r\sqrt{{{h}^{2}}+{{r}^{2}}}=\pi rl\]
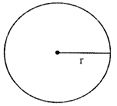
Sphere:- The set of all points in the space which are equidistant from fixed point is called a sphere.
Radius = r
Volume of a sphere\[~=\frac{4}{3}\pi {{r}^{3}}\]
Surface Area of a sphere \[=4\pi {{r}^{2}}\]
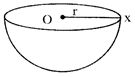
Hemisphere:- A plane through the centre of the sphere divides the sphere into two equal parts each of which is called a hemisphere.
Radius \[=Ox=r\]
Volume of a Hemisphere\[\frac{2}{3}\pi r3\]
Curved surface area of a Hemisphere \[=27\pi {{r}^{2}}\]
Total surface area of a Hemisphere \[=37\pi {{r}^{2}}\]
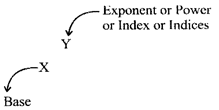
The first power of a number is the number itself. i.e., \[{{\mathbf{a}}^{\mathbf{1}}}=\mathbf{a}\]
The second power is called square. E.g., square of ‘5’ is \[{{5}^{2}}\]
The third power is called cube. E.g., cube of y is \[{{y}^{3}}\]
Number in Standard form:-
A number written as \[(x\times {{10}^{y}})\] is said to be in standard form if x is a decimal number such that \[1\le x\le 10\] and y is either a positive or a negative integer.
Expressing large numbers in standard form
E.g., Express 246784 in standard form
Solution:- \[246784=2.46784\times 100000\]
\[=\left( 2.4678\times {{10}^{5}} \right)\]
Expressing very small numbers is standard form
E.g., Express 0.00003 in standard form.
Direct & Inverse Proportional (Time & Work)
FUNDAMENTALS
Let 3 pens cost Rs. 9, then 6 pens will cost Rs. is
Clearly. More pens will cost more.
Again, if 2 women can do a piece of work in 7 hours, then 1 woman alone can do it in 14 hours.
Thus, less people at work, more will be the time taken to finish it.
Thus, change in one quantity brings a change in the other.
Variation: If two quantities depend upon each other in a way such that the change in one results in a corresponding change in the other, then the two quantities are said to be in variation. This variation may be direct (i.e. increase in one quantity leads to increase in other quantity) as illustrated in the example of "cost of pens" above. Variation may also be indirect (i.e. increase in one quantity leads to decrease in other quantity) as illustrated in the example of "work done by women" above.
There are many situations in our daily life where the variation in one quantity brings a variation in the other.
ILLUSTRATIONS:
More no. of articles will cost more (Direct Variation)
More is the number of workers at a work, less is the time taken to complete the work. (Indirect Variation)
For a given amount of money deposited in a bank, more is the rate of interest, more is the interest earned upon it in a fixed time period. (Direct Variation)
More is the distance covered by train, more will be electricity consumed by it. (Direct Variation)
Faster is the speed of train, lesser will be the time taken to cover a given distance. (Indirect Variation)
Direct Proportionality: Two quantities x and y are said to be in direct proportion if increase / decrease in the value of one variable x, leads to increase / decrease in the value of y, in such a way that the ratio \[\frac{x}{y}\] remains constant.
Hence, if x and y are directly proportional, then\[\frac{x}{y}=k\], where k is a constant. As x takes the values \[({{x}_{1}}={{x}_{2}}={{x}_{3}})\]and y. takes the values. \[({{y}_{1}},{{y}_{2}},{{y}_{3}})\]then,
\[\frac{{{x}_{1}}}{{{y}_{1}}}=\frac{{{x}_{2}}}{{{y}_{2}}}=\frac{{{x}_{3}}}{{{y}_{3}}}=....=K\]
Examples (1), (3) and (4) given above are the cases of direct proportion.
Consider a gas in a closed cylinder such that its volume (V) is kept constant. If you increase the temperature (T) of the gas, then its Pressure (P), which can be measured through a manometer, also increases.
If V= constant; \[\frac{P}{T}=k;\]
(in the example above, just try to understand \[\frac{{{x}_{1}}}{{{y}_{1}}}=\frac{{{x}_{2}}}{{{y}_{2}}}=\frac{{{x}_{3}}}{{{y}_{3}}}=....=k\] where the analogy for x is Pressure (P) and the analogy for y is temperature (T).
See the table on the right side. Column II represent temperature (T) whereas Column III represents pressure (P).
Divide each data in Column III by each data in Column II.
FACTORIZATION
FUNDAMENTALS
FACTORS: When an algebraic quantity can be expressed as the product of two or more algebraic quantities, then each of these quantities is called a factor of the given algebraic quantity and the process of finding factors, is called FACTORIZATION.
Remarks: Factorization is the opposite process of multiplication,
EXAMPLE Look at the examples given below:
It is advisable that students memorize squares of numbers from 1 to 20. E.g. here, \[\mathbf{1}{{\mathbf{5}}^{\mathbf{2}}}=\mathbf{225}\] and \[\mathbf{1}{{\mathbf{7}}^{\mathbf{2}}}=\mathbf{289}\] are readily used.
Factorization when a Common Monomial Factor Occurs in Each Term.
METHOD: Step 1. Find the HCF of all the terms.
Step2. Divide each term by this HCF.
Step3. Write the given expression= HCF \[\times \] quotient obtained in step 2.
Conceptual Framework / Idea behind above steps: HCF itself is one of the factors. Hence,
\[\text{other}\,\text{factor}\,\text{will}\,\text{be}\,\text{equal}\,\text{to}\frac{\text{Given}\,\text{pression}}{\text{HCF}}\]
EXAMPLE 1. Factorize (i.e. break into factors) each of the following:
(1) \[13n+117\]
(2) \[{{n}^{3}}+2n+{{n}^{2}}\]
(3) \[15{{x}^{2}}{{y}^{2}}{{z}^{2}}+5x{{y}^{2}}z+5xyz\]
(4) \[6ab-9bc\]
(1) \[13n+117=13\left( n+9 \right)\]
(2) \[{{n}^{3}}+2n+{{n}^{2}}=n({{n}^{2}}+2+n)\]
(3) \[15{{x}^{2}}{{y}^{2}}{{z}^{2}}+5x{{y}^{2}}z+5xyz=5xyz(3xyz+y+1)\]
Factorization when one or more Binomial is Common
METHOD: Step 1. Find the common binomial by intelligent thinking or by trial & error.
Step 2. Divide each term by this common binomial.
Step 3. Write the given expression = this binomial \[\times \] quotient obtained in Step 2
EXAMPLES. Factorize:
(1) \[6x\left( 3a-4b \right)+10y\left( 3a-4b \right)\]
(2) \[6\left( 16x-23y \right)-22{{\left( 16x-23y \right)}^{2}}\]
(3) \[mn{{\left( ax-2by \right)}^{2}}+m{{n}^{2}}(ax-2by)\]
We have,
(1) \[6x\left( 3a-4b \right)+10y\left( 3a-4b \right)\]
\[=\left( 6x+10y \right)\left( 3a-4b \right)\]
(2) \[6\left( 16x-23y \right)-22{{\left( 16x-23y \right)}^{2}}\]
\[=\left( 16x-23y \right)\left[ 6-22\left( more...
 According to another basis, polygons are classified as;
(i) Regular Polygons: Polygons in which all sides and all angles are equal, are called Regular Polygons. Specific names are given to each of them depending upon no of sides.
(a) In Triangles:
Equilateral \[\Delta \,1e\]
According to another basis, polygons are classified as;
(i) Regular Polygons: Polygons in which all sides and all angles are equal, are called Regular Polygons. Specific names are given to each of them depending upon no of sides.
(a) In Triangles:
Equilateral \[\Delta \,1e\]
 (b) In quadrilaterals: Square
 (c) In Pentagons: Regular pentagon
 (d) In Hexagons: Regular hexagon
 \[\angle A=\angle B=\angle C=\angle D=\angle E=\angle F={{120}^{{}^\circ }}\]& so on.
(ii) Irregular polygons: Polygons which do not nave equal sides or equal angles, are called Irregular Polygons.
Thus, RHOMBUS, which has equal sides but unequal angles, is irregular polygon.
Properties of Regular polygons:-
If n = no. of sides of a regular polygon, then,
(i) Exterior angle, \['\theta '=\left( \frac{{{360}^{{}^\circ }}}{n} \right)\]
(ii) Interior angle, = \[\left( {{180}^{{}^\circ }}-\theta \right)\]
(iii) No. of diagonals of polygons of 'n’ sides \[=\frac{n(n-2)}{2}\]
\[\angle A=\angle B=\angle C=\angle D=\angle E=\angle F={{120}^{{}^\circ }}\]& so on.
(ii) Irregular polygons: Polygons which do not nave equal sides or equal angles, are called Irregular Polygons.
Thus, RHOMBUS, which has equal sides but unequal angles, is irregular polygon.
Properties of Regular polygons:-
If n = no. of sides of a regular polygon, then,
(i) Exterior angle, \['\theta '=\left( \frac{{{360}^{{}^\circ }}}{n} \right)\]
(ii) Interior angle, = \[\left( {{180}^{{}^\circ }}-\theta \right)\]
(iii) No. of diagonals of polygons of 'n’ sides \[=\frac{n(n-2)}{2}\]
 Adjacent sides of a more...
 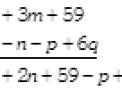 Example 2- Add: \[9{{x}^{3}}+6{{x}^{5}}-8+16{{x}^{2}}\] and \[10{{x}^{8}}6{{x}^{2}}+9{{x}^{3}}-3x\]
Solution: Writing the given expressions in descending powers of x in the form of rows with like terms below each other and adding column wise, we get:
Example 2- Add: \[9{{x}^{3}}+6{{x}^{5}}-8+16{{x}^{2}}\] and \[10{{x}^{8}}6{{x}^{2}}+9{{x}^{3}}-3x\]
Solution: Writing the given expressions in descending powers of x in the form of rows with like terms below each other and adding column wise, we get:
 Subtraction of Algebraic Expressions
Steps:
Subtraction of Algebraic Expressions
Steps:
 Multiplication of Algebraic Expressions
As we learnt in chapter 6, Class VII GMO Book,
Multiplication of Algebraic Expressions
As we learnt in chapter 6, Class VII GMO Book,
 Volume of the cuboid \[={{l}^{2}}\times b\times h\]
Diagonal of the cuboid \[=\sqrt{{{l}^{2}}+{{b}^{2}}+{{h}^{2}}}\]
Volume of the cuboid \[={{l}^{2}}\times b\times h\]
Diagonal of the cuboid \[=\sqrt{{{l}^{2}}+{{b}^{2}}+{{h}^{2}}}\]
 If length of each edge of a cube is a.
Then, volume of the cube \[={{a}^{3}}\]
Total surface area of the cube \[=6{{a}^{2}}\]
Diagonal of the cube\[=\sqrt{3a}.\]
If length of each edge of a cube is a.
Then, volume of the cube \[={{a}^{3}}\]
Total surface area of the cube \[=6{{a}^{2}}\]
Diagonal of the cube\[=\sqrt{3a}.\]
 Volume of the cylinder \[=\pi {{r}^{2}}h\]
Area of the base \[=\pi {{r}^{2}}\]
Area of the curved surface \[=2\pi rh\]
Total surface Area
\[=27\pi rh+2{{\pi }^{2}}h=2\pi r(h+r)\]
Volume of the cylinder \[=\pi {{r}^{2}}h\]
Area of the base \[=\pi {{r}^{2}}\]
Area of the curved surface \[=2\pi rh\]
Total surface Area
\[=27\pi rh+2{{\pi }^{2}}h=2\pi r(h+r)\]
 Radius = r, Height = h
Slant height = l
Volume of the cone \[\frac{1}{3}=\pi {{r}^{2}}h\]
Area of the Base \[=\pi {{r}^{2}}\]
Area of the curved surface \[=\pi r\sqrt{{{h}^{2}}+{{r}^{2}}}=\pi rl\]
Radius = r, Height = h
Slant height = l
Volume of the cone \[\frac{1}{3}=\pi {{r}^{2}}h\]
Area of the Base \[=\pi {{r}^{2}}\]
Area of the curved surface \[=\pi r\sqrt{{{h}^{2}}+{{r}^{2}}}=\pi rl\]
 Radius = r
Volume of a sphere\[~=\frac{4}{3}\pi {{r}^{3}}\]
Surface Area of a sphere \[=4\pi {{r}^{2}}\]
Radius = r
Volume of a sphere\[~=\frac{4}{3}\pi {{r}^{3}}\]
Surface Area of a sphere \[=4\pi {{r}^{2}}\]
 Radius \[=Ox=r\]
Volume of a Hemisphere\[\frac{2}{3}\pi r3\]
Curved surface area of a Hemisphere \[=27\pi {{r}^{2}}\]
Total surface area of a Hemisphere \[=37\pi {{r}^{2}}\]
Radius \[=Ox=r\]
Volume of a Hemisphere\[\frac{2}{3}\pi r3\]
Curved surface area of a Hemisphere \[=27\pi {{r}^{2}}\]
Total surface area of a Hemisphere \[=37\pi {{r}^{2}}\]