Answer:
From the graph,
(i) Initial velocity, u = 0
[Since, displacement and time is zero]
(ii) Velocity after 50s,![]() [
[![]() Given,
displacement = 100m ]
Given,
displacement = 100m ]
![]()
![]() (iii) Velocity after
(iii) Velocity after ![]() [Here, displacement =
zero and time = 100s]
[Here, displacement =
zero and time = 100s]
![]()
![]() Therefore,
Therefore,
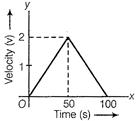
Velocity-time graph plotted from the above data is shown below
v
0
2
0
t
0
50
100


You need to login to perform this action.
You will be redirected in
3 sec

