| Season | No. of Votes |
| Summer | 90 |
| Rainy | 120 |
| Winter | 150 |
Answer:
(i) Winter season got the most votes. (ii) Central angle of winter sector \[=\frac{\begin{align} & \text{Number of people who vote} \\ & \text{ for}\,\text{winter}\,\text{season} \\ \end{align}}{\text{Total}\,\text{number}\,\text{of}\,\text{people}}\,\ \times {{360}^{\text{o}}}\] \[=\frac{150}{360}\times 360{{}^{\text{o}}}\times {{150}^{\text{o}}}\] Central angle of summer sector \[\text{=}\frac{\begin{align} & \text{Number of people who vote} \\ & \text{ }\,\,\,\,\,\,\,\,\,\,\,\text{for}\,\text{summer}\,\text{season} \\ \end{align}}{\text{Total}\,\text{number}\,\text{of}\,\text{people}}\,\ \text{ }\!\!\times\!\!\text{ 36}{{\text{0}}^{\text{o}}}\] \[=\frac{90}{360}\times {{360}^{\text{o}}}={{90}^{\text{o}}}\] Central angle of rainy sector \[\text{=}\frac{\begin{align} & \text{Number of people who vote } \\ & \,\,\,\,\,\,\,\,\,\,\text{ for}\,\text{rainy}\,\text{season} \\ \end{align}}{\text{Total}\,\text{number}\,\text{of}\,\text{people}}\,\ \text{ }\!\!\times\!\!\text{ 36}{{\text{0}}^{\text{o}}}\] \[=\frac{120}{360}\times {{360}^{\text{o}}}={{120}^{\text{o}}}\] (iii)
Pie chart Season People who Voted for it In fraction Central angle Winter 150 \[\frac{5}{12}\] \[\frac{5}{12}\] of \[{{360}^{\text{o}}}={{150}^{\text{o}}}\] Summer 90 \[\frac{1}{4}\] \[\frac{1}{4}\] of \[{{360}^{\text{o}}}={{90}^{\text{o}}}\] Rainy 120 \[\frac{1}{3}\] \[\frac{1}{3}\] of \[{{360}^{\text{o}}}={{120}^{\text{o}}}\] 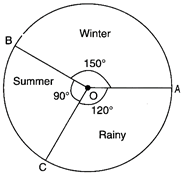


You need to login to perform this action.
You will be redirected in
3 sec

