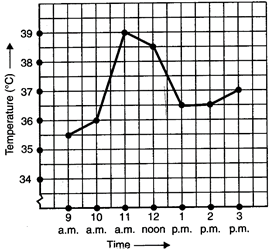
 (e) During which periods did the patient's temperature showed an upward trend?
Answer:
(a) The patient's temperature at 1 d m was \[{{36.5}^{o}}C\]. (6) The patient's temperature was \[{{38.5}^{o}}C\] at 12 noon. (c) The two times when the patient's temperature was the same were 1 p.m. and 2 p.m. (d) The temperature at 1.30 p m was \[{{36.5}^{o}}C\]. The point between 1 p.m. and 2 p.m. on the x-axis is equidistant from the two points showing 1 p.m. and 2 p.m., so it will represent 1.30 p.m. Similarly, the point on the y-axis between \[{{36}^{o}}C\] and \[{{37}^{o}}C\] will represent \[{{36.5}^{o}}C\]? (e) The patient's temperature showed an upward trend during the periods 9 a.m. to 10 a.m., 10 a.m. to 11 a.m. and 2 p.m. to 3 p.m.


You need to login to perform this action.
You will be redirected in
3 sec

