LEARNING OBJECTIVES
This lesson will help you to:
- collect data from different sources.
- record data using tally marks.
- prepare tables for recording data.
- represent data in terms of pictograph choosing appropriate unit for displaying data.
- represent data in terms of bar charts choosing appropriate scale for displaying data.
- recognize patterns in the data.
- draw conclusions from the data by discussing with teacher.
Real Life Examples
- A pictograph represents data in the form of pictures, objects or pars of objects and helps us to answer questions on the data at a glance.
- Pictographs helps us to represent different types of sales of a store with the help of images, for example, shoe sales, TV sales, phone sales, computer sales, etc.
- A bar graph would allow you to display population of several different countries at one time.
- Data Handling is widely used in collection of scores of students in various exams and marking ranks to the students.
ORGANIZATION OF DATA
Once we have some information / data, the next step is to get results from it. This can be done by arranging it. To make sense of the gathered information. It has to be organized and put into tables. We can make a tables by using a picture for each. Such an arrangement is called as. Pictograph.
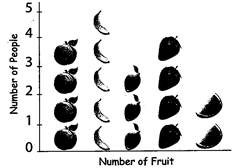
Example of a pictograph
Number of people with their favorite fruit can be shown using chart as given below;
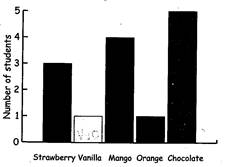
Number of students with their favorite ice cream can be shown using a bar chart as given below:
- For gathered information to make sense it has to be organized and put into tables.
- Two ways of representing information are tally marks and pictographs.
- Pictographs are exciting and simple as they show information with the help of pictures or symbols.
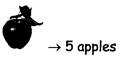
- In pictograph. One symbol can be used to represent more than one item for example.
- When the number for each category is quite large drawing picture is not easy. To solve this problem we draw bars to represent numbers. These bars are called as Tally Marks.
To represent numbers tally marks are used in the following way
|
We represent 1 by I
|
We represent by \[\cancel{||||}\]I
|
|
We represent by II
|
We represent by \[\cancel{||||}\]II
|
|
We represent by III
|
We represent by \[\cancel{||||}\]III
|
|
We represent by IIII
|
We represent by \[\cancel{||||}\]IIII
|
|
We represent by \[\cancel{||||}\]
|
We represent by \[\cancel{||||}\]\[\cancel{||||}\]
|
When tally marks are made, the first four marks are made like this ||||. Then the fifth marks is made across the four marks\[\cancel{||||}\]. This makes it easy to court the marks.
Historical preview
- Pictograph was the earliest form of writing. It was also the first alphabet. Pictograph lasted form about 3000 B.C. to about the 18th
- Most ancient people wrote pictograph on stone or clay with a stylus made out of long reeds, “wood, or bone with a narrow, rectangular head.”
- William Play fair invented bar charts in 1786.
Amazing Facts
- All the following facts are a result of data handling process:
- Thomas Alva Edison pretended almost 1300 inventions in his life time.
- It takes 6 months to build a Rolls Royce and 13 hours to build a Toyota.
- There are 86,400 Seconds in a day.
Misconcept / Concept
Misconcept: Tally mark to Represent 5 is \[|||||\]
Concept: Tally mark to represent 5 is\[\cancel{||||}\].
Misconcept: A picture of an object shown in a pictograph represents one object only.
Concept: A picture of an object shown in a pictograph does not always represents on object only.
DATA HANDLING PROCESS/ CYCLE
- Specify the problem: Ask a question or questions
- Plan: Decide what data to collect, who to collect it from and how you will be collected it.
- Process and Represents: Reduce the data to summarize information and represent them using tables, charts, bar graphs, pictographs, etc.
- Interpret and discuss: Interpret and analyze the tables and charts to draw conclusions.
SHORTCUT TO PROBLEM SOLVING:
- Read the data carefully as the smallest detail may change the meaning of the whole data collected. For example, if you are collecting data about number of students who likes chocolate, ice cream or vanilla ice cream and a student says he does not like vanilla ice cream, then that does not mean he likes chocolate ice cream.
- Record the data in tabular forms because tables help to understand the data.
- Try to understand the data provided carefully before jumping to answer the questions.
- Relate the data given in table with charts and graphs and draw them to have a better understanding of it.
- Be very careful of the units used in the tables. For example, height of students in centimeters or feet.
- Take care of the scale used in charts and graphs. For example, 1 picture of cup 1= 10 cups of tea, etc.


