Graphical Representation of Data
Category : 5th Class
Graphical Representation of Data
Introduction
You might have seen in the books, newspaper etc, graphs are used to give some valuable information, like people living under poverty line in different states, number of mal- nutritioned child in different Asian countries, number of unemployed people in India, number of uneducated people in a particular state etc. In this chapter we will study about the data and analysis of data with the help of graph.
Data
The information, which is in the numeral form, is called data. The data is gathered in various ways. Then it is manipulated and represented on the graph.
Raw Data
The initial data that the observer collects himself is called raw data.
Grouped Data
When raw data is arranged in a table in order to extract the information contained by it easily, is called grouped data.
Presentation of Data
Data is presented with the help of different types of graphs, which are as follows.
Pictograph
When the data is represented on the graph with the help of pictures, it is known as Pictograph.
In the following pictograph, number of students who are present in different classes has been shown:
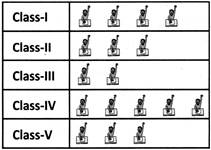
Key: One boy represents 8 students.
(a) How many students were present in class III?
(b) In which class least number of students were present?
(c) How many students were present in class IV and class V together?
(d) How many more students was present in class IV in comparison of class III
Solution:
(a) 16 (b) Class III
(c) 64 (d) 24
Bargraph
When the data is represented on the graph with the help of bars, it is known as Bargraph.
In the following bar graph, number of fans sold by a shop during a week has been shown.
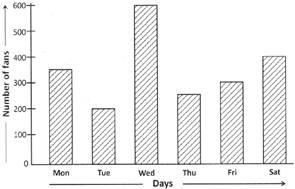
(a) How many fans were sold by the shop during the week?
(b) On which day, maximum number of fans were sold?
(c) How many more fans were sold on Wednesday in comparison to Tuesday?
(d) On which day 400 fans were sold?
Answer:
(a) 2100
(b) Wednesday
(c) 400
(d) Saturday


You need to login to perform this action.
You will be redirected in
3 sec

