Data Handling
Category : 6th Class
Data Handling
Learning Objectives
Data
A collection of information in the form of numerical figures is called data.
Raw data: Data obtained in the original form is called raw data.
Tabulation of data: Arranging the data in a systematic form in the form of a table is known as tabulation of data.
Statistics
The branch of mathematics which deals with the collection, presentation, analysis and interpretation of numerical data is called statistics.
Example
A dice was thrown 30 times and the following outcomes were noted:
4, 3, 3, 2, 5, 4, 4, 6, 1, 2, 2, 3, 4, 6, 2, 3, 3, 4, 1, 2, 3, 3, 4, 5, 6, 3, 2, 1, 3, 4.
Represent the above data in the form of frequency distribution.
Explanation: We may present the data as shown below:
|
Outcome |
Tally marks |
No. of outcomes |
|
1 |
|
3 |
|
2 |
|
6 |
|
3 |
|
9 |
|
4 |
|
4 |
|
5 |
|
2 |
|
6 |
|
3 |
Pictograph
The representation of information through pictures is called a pictograph.
Example
The following pictograph shows the number of computers sold by a company during a week.
The scale used: ![]() computers.
computers.
|
Monday |
|
|
Tuesday |
|
|
Wednesday |
|
|
Thursday |
|
|
Friday |
|
|
Saturday |
|
Bargraph
A bar graph is a pictorial representation of the numerical data by a number of bars of uniform width erected horizontally or vertically with equal spacing between them.
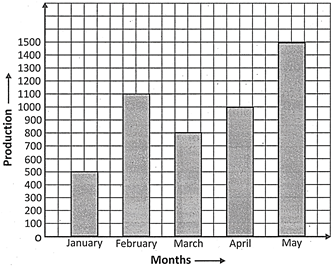
Example
Given below is the bargraph showing the number of scooters produced in a factory during the first five months of a year.
Commonly Asked Questions
Direction: Questions 1 and 2 are based on the following pictograph.
The following pictograph shows the number of balls sold by a shopkeeper on different days of a week.
|
Day |
No. of balls sold |
|
Monday |
|
|
Tuesday |
|
|
Wednesday |
|
|
Thursday |
|
|
Friday |
|
|
Saturday |
|
On which day the maximum number of balls were sold by the shopkeeper?
(a) Monday (b) Tuesday
(c) Thursday (d) Friday
(e) None of these
Answer (c)
Explanation: It is clear from the pictograph that maximum number of balls was sold on Thursday.
How many balls were sold on Tuesday?
(a) 16 balls (b) 24 balls
(c) 32 balls (d) 40 balls
(e) None of these
Answer (b)
Explanation: The number of balls sold on Tuesday \[=8\times 3=24.\]
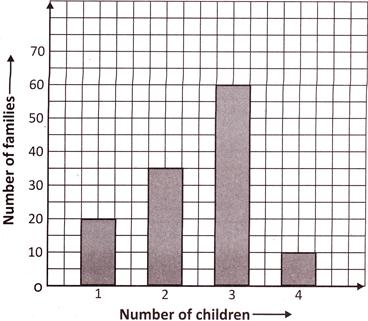
Direction: Questions from 3 to 5 are based on the following bargraph.
In a survey of 130 families of a colony, the number of children in each family was recorded and the data have been represented by the bar graph given below.
Commonly Asked Questions
How many families have 3 children?
(a) 20 (b) 40
(c) 30 (d) 60
(e) None of these
Answer: (d)
Explanation: It is clear from the bargraph that 60 families have 3 children each.
How many families have no child?
(a) 5 (b) 4
(c) 10 (d) 15
(e) None of these
Answer (a)
Explanation: Number of families having 1 or more children \[=20+35+60+10=125\]
Therefore, number of families having no child \[=130-125=5.\]
How many children do the maximum number of families have?
(a) 50 (b) 60
(c) 40 (d) 30
(e) None of these
Answer (b)
Explanation: It is clear from the bargraph that the maximum number of families have 3 children.


You need to login to perform this action.
You will be redirected in
3 sec

