STATISTICS
FUNDAMENTALS
- Statistics is a branch of mathematics which is useful in data collection, data classification and data interpretation.
Data
- It is a information in the form of a numerical figures.
Frequency
- The number of times a particular observation occurs in the data is called its frequency.
Range
- The difference of the largest and smallest values of the given data is called its range.
Lower limit and upper limit
- In the classes 10 - 20, 20 - 30, 30 " 40, the value 10, 20 and 30 are called the lower limit of the classes and the values 20, 30 and 40 are called the upper limits of the classes.
Class Mark
- Class-mark of a class a-b is equal to \[\frac{a+b}{2}\]
Cumulative frequency
- The frequency of the first class is added to that of the second and this sum is added to that of the third and so on. Then the frequencies so obtained are known as commutative frequency
Geographical Representation of data
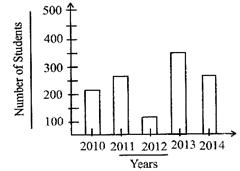
- Bar Graph: Bar graph is a pictorial representation of a data in which usually bars of uniform width are drawn with equal spacing between them on one axis (x - axis) depicting the variables. The value of the variable are shown on the other axis (y axis) and the height of the bars depend on the value of the variable.
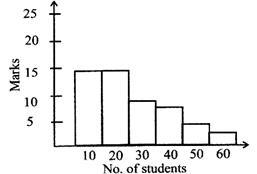
- Histogram: This is a form of representation like the bar graph, but it is used for continuous class interval. It consist of a set of continuous bars drawn adjacent to each other.
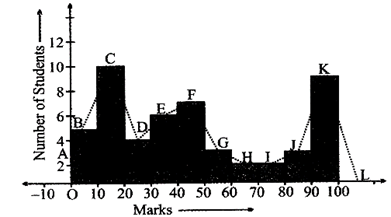
- Frequency Polygon: Frequency polygon are used to represent classified or grouped data graphically. It is a polygon whose vertices are the mid-points of the top sides of the rectangles, forming the histogram of the frequency distribution
Central Tendency
- Mean: The mean of a number of observation is the sum of values of the all the observations divided by the total number of observations. It is denoted by \[\overline{X}\].
Therefore the mean \[\overline{X}=\frac{\text{Sum of all observations}}{\text{Total No}\text{. of observations}}\]
If \[{{x}_{1}},{{x}_{2}},{{x}_{3}},.......{{x}_{n}}\]are the observations and their respective frequencies are \[{{f}_{1}},{{f}_{2}},{{f}_{3}},........{{f}_{n}},\]then
\[\overline{X}=\frac{{{f}_{1}}{{x}_{1}}+{{f}_{2}}{{x}_{2}}+{{f}_{2}}{{x}_{3}}+....{{f}_{n}}{{x}_{n}}}{{{f}_{1}}+{{f}_{2}}+{{f}_{3}}+......+{{f}_{n}}}\]
- Median: The median is that value of the given number of observation, which divided it into exactly two points. So, when the data is arranged in ascending or descending order the median of ungrouped data in calculated as follows -
(I) When the number of observations is odd the median is the value of the \[{{\left( \frac{n+1}{2} \right)}^{th}}\]observation.
(II) When the no. of observation is even, the median is \[{{\left( \frac{n}{2} \right)}^{th}}\] and \[{{\left( \frac{n}{2}+1 \right)}^{th}}\]observations.
Mode: The mode is the value of the observation which occurs most frequently i.e. an observation with the maximum frequency is called the mode.


