9th Class Mathematics Statistics

Statistics

Category : 9th Class

Statistics


  • Statistics, a branch of mathematics is useful in the collection, classification and interpretation of data.


  • The word statistics is used in two different senses:

            (i) In plural sense, statistics means data.

            (ii) In singular sense, statistics is the science which deals with the collection, presentation, analysis and interpretation of some numerical data.


  • Data: The word data means information in the form of numerical figures or a set of given facts.


  • A statistical data is collected by a single person or by a group of persons having uniform approach.

            Someone who carries out the job of collection of data is called an investigator.


  • Primary data: The data collected for a definite purpose by an investigator or a group of investigators directly, is called primary data.


  • Secondary data: The data collected from a source which already has the information stored, is called secondary data.


  • Raw data: An information of facts and figures collected for a definite purpose in any manner is termed as raw data.


  • Tabulation: Arranging the data in a systematic way in tabular form is called tabulation.


  • Observation: Each numerical figure in a data is called an observation.


  • Frequency: The number of times a particular observation occurs in the data is called its frequency.


  • Range: The difference of the greatest and the least values of the given data is called its range.


  • To determine the frequency of each distinct entry of the data, we draw tally marks in the form of small vertical lines, called bars.


  • Grouped frequency distribution: When a data has a large number of values (entries) and most of them are distinct, it becomes inconvenient to present it in the form of ungrouped frequency distribution. The data is condensed into a finite number of groups called classes of the data. Presenting data in this form is called a grouped frequency distribution.


  • Frequency of a grouped data: The number of entries of the data having their values lying in a class is defined as the frequency of the class. The table, in which the corresponding frequencies are written against each class, is called a frequency distribution of the given data.


            Types of frequency distribution: There are two types of grouped frequency distributions of a data. They are:

            (i) Inclusive method or discrete form.

            (ii) Exclusive method or continuous form.


  • Lower limit and upper limit: In the classes 0-9, 10-19,20 - 29 and 30-39, the values 0,10,20 and 30 are called the lower limits of the classes and the values 9,19,29 and 39 are called the upper limits of the classes.


  • Presentation of a data in the form of continuous grouped frequency distribution has some advantage in comparison to the discrete grouped frequency distribution.


  • Class mark (or Midmark or Midvalue) of a class: In a grouped frequency distribution, the a+b class mark or the midmark of a class a - b is equal to the value\[\frac{a+2}{2}\].


  • Cumulative frequency table: The total of the frequency of a class and the frequencies of all the classes preceding that class is called the cumulative frequency of that class.


  • The table showing the cumulative frequencies recorded against each class is called cumulative frequency table.


  • Graphical representation of data: The main features of a frequency distribution can be easily presented with the help of graphical representation such as bar graphs, histograms, frequency polygons, etc.


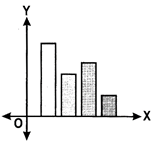
            (i) Bar graph: A bar graph (diagram) is a pictorial representation of the numerical data by a series of bars or rectangles of uniform width standing on the same horizontal (or vertical) base line with equal spacing between the bars. Each rectangle or bar represents only one value of the data.                                           


(ii) Histogram: histogram is a graphical representation of grouped frequency distribution for continuous classes in the form of rectangles with class intervals as bases and corresponding frequencies as heights.


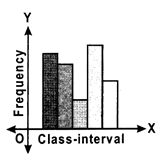
Note: In a histogram, rectangles are drawn leaving no gap in, between consecutive rectangles.      


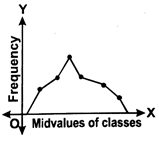
Frequency polygon: If the points pertaining to the midvalues of the classes of a frequency distribution, and the corresponding frequencies are plotted on a graph sheet and these points are joined by straight lines, then the figure formed is called a frequency polygon, Frequency polygons are useful for large and continuous data.                         


  • It is also useful for comparing two different sets of data of the same nature.


  • Measures of central tendency (of ungrouped data):

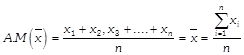
            (i) Arithmetic Mean (A.M.) or Mean: Arithmetic mean or simply mean is the most common and widely used measure of central tendency. It is found by adding all the values of the observations and dividing it by the total number of observations. It is denoted by \[\overline{x}\](Read as x bar.).

          \[\overline{x}=\frac{\sum\limits_{i=1}^{n}{{{f}_{i}}{{x}_{i}}}}{\sum\limits_{i=1}^{n}{{{f}_{i}}}}\]


            If \[{{x}_{1}}{{x}_{2}}\,,...,{{x}_{n}}\]are 'n' observations, then Arithmetic Mean


(ii) Median: If the observations are arranged in increasing or decreasing order, then median is defined as the middle-most observation.

            If the number of observations is odd, median is the value of the\[{{\left( \frac{n+1}{2} \right)}^{th}}\] observation.

            If the number of observations is even, median is the mean of the values of\[{{\left( \frac{n}{2} \right)}^{th}}\]and \[{{\left( \frac{n}{2}+1 \right)}^{th}}\]observations.


            (iii) Mode: An observation with the highest frequency is called the mode.


Other Topics

Notes - Statistics


You need to login to perform this action.
You will be redirected in 3 sec spinner