Data Interpretation
Category : 9th Class
DATA INTERPRETATION
Learning Objectives
Introduction
The interpretation of data is the process through which Inferences are drawn on the data available for analysis.
In other words, the process of drawing inferences and conclusion through the interpretation of data is all about Dl.
Type of Data Interpretation
There are three types of data interpretation.
(i) Pie Chart
(ii) Bar Graph
(iii) Line Graph
Pie Chart
A Pie Chart is a pictorial representation of a numerical data by non-intersecting adjacent sectors of the circle, such that, area of each sector is proportional to the magnitude of the data represented by the sector
(a) The whole circle represents the total and the sectors, individual quantities.
(b) The sectors, are made considering the fact that the central angle is \[360{}^\circ \].
(c) The central angle, \[360{}^\circ \]can be divided in the ratio of quantities given.
(d) Central angle or Angle of the sector is:
Central angle or angle of the sector \[=\,\left( \frac{\text{Value}\,\text{of}\,\text{the}\,\text{component}\,}{\text{Total}\,\text{Value}\,}\,\times \,360{}^\circ \right)\]
Example:
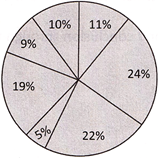
The number of students studying in different faculties in the years 2010 and 2011 from state
A is as follows:
Total % of students for year 2010
Total students – 35000

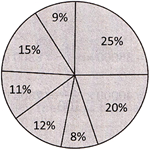
Total % of students for year 2011
Total students 40000
Example:
(a) Arts (b) Agriculture
(c) Pharmacy (d) All of these
(e) None of these
Answer: (b)
Explanation: For Arts, Number of students in 2010 and 2011
\[35000\times \frac{12}{100}=4200.\] \[42000\times \frac{11}{100}=4400\]
For Agriculture Number of students in 2010 and 2011
\[35000\times \frac{7}{100}=2450,\] \[40000\times \frac{5}{100}=2000,\]
For pharmacy % is already more and total number of students are already more in
2011, so correct option will be for Agriculture, option (b) is true.
(a) \[4:3\] (b) \[3:2\]
(c) \[2:3\] (d) \[7:12\]
(e) None of these
Answer (d)
Explanation: Ratio between the number of students studying pharmacy in the years 2010 and 2011
\[=\frac{35000\times \frac{6}{100}=\frac{7}{12}\,}{40000\times \frac{9}{100}}\]
Option (d) is correct.
(a) 17 (b) 15
(c) 20 (d) 23
(e) None of these
Answer (C)
Explanation:
Number of engineering students in \[2010=35000\times \frac{18}{100}=6300\,\,\operatorname{in}\,\,2010\]
Number of engineering students in \[2011=40000\times \frac{19}{100}=7600\,\,\operatorname{in}\,\,2011\]
Total increase \[=\text{ }7600-6300=1300\]
% increase \[=\frac{1300}{6300}\times 100=20.63%\cong 20%\]
(a) 76 (b) 85
(c) 82 (d) 79
(e) None of these
Answer (b)
Explanation: Number of students studying Arts and Commerce together in 2010\[=35000\,\,\times \,\,\frac{34}{100}=11900,\,\,\operatorname{in}\text{ }2010\]
Number of students studying Arts and Commerce together in 2011
\[\text{40000}\times \frac{35}{100}=\text{ }14000,\,\,\operatorname{in}\text{ }2011\]
Required % \[=\frac{11900}{14000}\times =100=\,\,85%\]
So, option (b) is correct
Commonly Asked Questions
Study the given graph and table and answer the following questions. (Total population of all states given in Pie chart is 25 lakh).
In the year 2004 the data of different states regarding population of states
Population %
Sex and literacy wise population ratio
|
States |
Sex |
Literacy |
||
|
|
M |
F |
Literate |
Illiterate |
|
UP |
5 |
3 |
2 |
7 |
|
Bihar |
3 |
1 |
1 |
4 |
|
AP |
2 |
3 |
2 |
1 |
|
Kar |
3 |
5 |
3 |
2 |
|
MH |
3 |
4 |
5 |
1 |
|
TN |
3 |
3 |
7 |
2 |
|
Kerala |
3 |
4 |
9 |
4 |
(a) 3 lakhs (b) 3.5 Lakhs
(c) 4.54 lakhs (d) 6.55 lakhs
(e) None of these
Answer (c)
Explanation: Population of Kar is 15 %
Production of Kar \[=\frac{25\times 15}{100}=\frac{15}{4}\] lakhs
So, total number of literate people in Kar is:
Literates in Kar \[=\frac{3}{3+2}\times \frac{15}{4}=225\]
Population of MH is 11%
Population of MH \[=\frac{25\times 11}{100}=\frac{11}{4}\] lakhs
Literates in MH \[=\frac{5}{5+1}\times \frac{11}{4}=2.29\] lakhs
So, number of literate people in MH and Kar together \[=\text{ }2.29+2.25=4.54\] laks,
(a) 20% (b) 24%
(c) 28% (d) 30%
(e) 25%
Answer (b)
Explanation: Population in UP is 25 %
Population of UP \[=\frac{25\times 25}{100}=\frac{25}{4}=6.25\,\text{lakhs}\]
Male people in\[\text{UP}=6.25\times \,\frac{5}{5+3}=6.25.\times \frac{5}{8}=3.93\,\text{lakhs}\]
Population in MH \[=2.75\,\text{lakhs}\]
Male people in MH \[=2.75\times \frac{3}{3+4}=1.17\,\text{lakhs}\]
Population of Kerala \[=8%\]lakhs
Population of Kerala \[=\frac{25\times 8}{100}=2\,\text{lakhs}\]
Male Population of Kerala \[=2\times \frac{3}{3+4}=0.58\] lakhs
So, sum of male population of UP, MH and Kerala \[=\text{ }3.93+1.17+0.85\text{ }=\text{ }5.95\text{ lakhs}\]
\[5.95=\text{ }\frac{25x}{100}\Leftrightarrow \text{x}=24%\] of total, option (b) is correct
Bar Graphs
A barograph displays data visually and is sometimes called a bar chart or a bar graph. Data is displayed either horizontally or vertically and allows viewers to compare items displayed. Data displayed will related to things like amounts, characteristics, times and frequency etc.
Example:
Production of steel by six different companies in three consecutive years 1994 – 95 – 96 (In Lakh Tonnes) are being given.
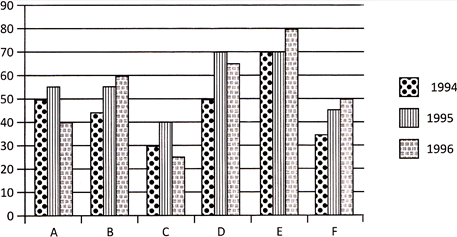
(a) 936666 tonnes (b) 906666 tonnes
(c) 916666 tonnes (d) 926666 tonnes
(e) None of these
Answer (c)
Explanation: Sum of production in \[1995=55+55+40+70+70+45=335\]
Sum of production in \[1994=50+45+30+50+70+35=280\]
So, difference \[=\text{ }\frac{335-280}{6}=9.16666667\]
Difference \[=916666\] tonnes.
(a) 32.8% (b) 37.5%
(c) 32.3% (d) 32.9%
(e) None of these
Answer: (b)
Explanation: For company c production in 1995 = 40 and in 1996 = 35
% Decline\[=\text{ }\frac{40-25}{40}\times 100=37.5%\].
(a) E and F (b) D and F
(c) E and C (d) A and E
(e) None of these
Answer (c)
Explanation: From the graph we can see that highest production average is for company E and lowest production average is for company C so difference between average productions for the three years is maximum for company E and C So, option (c) is correct.
Commonly Asked Questions
Total sale of English and Hindi Newspapers in five different localities of a city are given
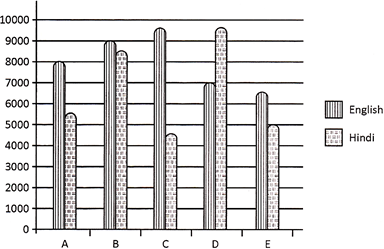
(a) 6000 (b) 6500
(c) 7000 (d) 7500
(e) None of these
Answer: (b)
Explanation: Total Sum of all the English Newspapers
\[=7500+9000+9500+7000+6500=39500\]
Total Sum of all the Hindi Newspapers
\[=\text{ }5500+8500+4500+9500+5000=33000\]
Difference \[=\text{ }39500-33000=6500,\] so option (b) is correct.
(a) \[11:19\] (b) \[6:5\]
(c) \[5:6\] (d) \[19:11\]
(e) None of these
Answer (a)
Explanation: sale of Hindi Newspapers in locality \[A=5500\]
sale of Hindi Newspapers in locality \[D=9500\]
Required \[=\frac{5500}{9500}=\frac{11}{19}\]
So, option (a) is correct.
(a) 162 (b) 84
(c) 68 (d) 121
(e) None of these
Answer; (c)
Explanation: Sum of the sale of English Newspaper in localities B and D together
\[=9000+7000=16000\]
Sum of the sale of English Newspaper in localities A, C and E together\[=7500+9500+6500=23500\]
\[\therefore \] Required % \[=\text{ }\frac{16000}{23500}\times 100=68%\]
So, option (c) is correct.
Line Graphs
A diagram of lines made by connected points which represent successive in the value of a variable quantity or quantities.
Example:
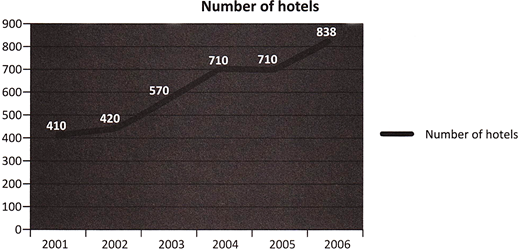
(a) 75 (b) 100
(c) 125 (d) 150
(e) None of these
Answer (b)
Explanation: % increase \[=\frac{838-410}{410}\times 100=104.3\approx ~100%.\] Option (b) is correct.
(a) Minimum 75 (b) Minimum 70
(c) Minimum 50 (d) Minimum 139
(e) None of these
Answer: (d)
Explanation: First find % increase in 2006 from 2006
% increase \[=\frac{838-710}{710}\times 100=18%\]
Now 18% of 838 = 150. So, option (d) is correct.
Commonly Asked Questions
% profit earned by two companies over the years is given in graph.
\[\text{Also}\,\text{ }\!\!%\!\!\text{ }\,\text{profit}\,\text{=}\frac{\text{Income}\,\text{-}\,\text{Expenditure}\,}{\text{Expenditure}\,}\times 100.\]
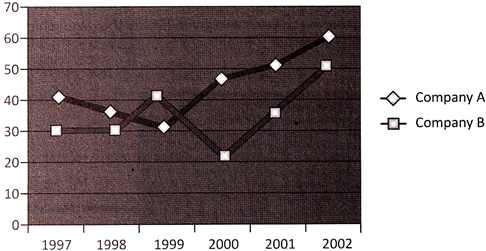
(a) Rs. 240 crores (b) Rs. 220 crores
(c) Rs. 160 crores (d) Rs. 125 crores
(e) None of these
Answer (a)
Explanation: Let income be Rs. x crores so, we can use the above formula as
\[20=\frac{x-200}{200}\times 100\]
\[40=x-200\]
\[x=240\]crores
(a) Rs.360 crores (b) Rs.480 crores
(c) Rs.375 crores (d) Rs.555 crores
(e) None of these
Answer (C)
Explanation: For company A in 2002% profit was 60%, Let expenditure be x crores, so
\[60=\frac{600-x}{x}\times 100\Leftrightarrow x=375\] crores
(a) \[1:2\] (b) \[26:27\]
(c) \[100:67\] (d) \[28:19\]
(e) None of these
Answer: (b)
Explanation: Let, the income of both companies be P, expenditure of A is \[{{E}_{1}}\]and expenditure of B is \[{{E}_{2}}\] Now we can write,
\[35=\frac{P-{{E}_{1}}}{{{E}_{1}}}\Leftrightarrow {{E}_{1}}=\frac{100P}{135}\]
\[30=\frac{P-{{E}_{2}}}{{{E}_{2}}}\Leftrightarrow {{E}_{2}}=\frac{100P}{135}\]
\[\frac{{{E}_{1}}}{{{E}_{2}}}=\frac{130}{135}=\frac{26}{27}\]
So, option (b) is correct.


You need to login to perform this action.
You will be redirected in
3 sec

