Ecology and Environment
Ecosystem
- The term ‘ecosystem’ was proposed by a British ecologistG. Tansley (1935). It represents the basic fundamental, functional unit of ecology which comprises of the biotic community together with its abiotic (non-living) environment.
- Ecosystem is the functional unit of nature where livingorganisms interact with each other and with their
- Ecosystems can be recognized as self-regulating and self-sustaining units of landscapes that may be terrestrial or Forests, grasslands and deserts are examples of terrestrial ecosystems. The aquatic ecosystems can be either fresh water (ponds, lakes, streams) or salt water (marine estuaries) type.
- Ecosystem may be natural (forest, sea), if developed under natural conditions or artificial (garden, aquarium, agriculture) if created by man.
- Ecosystem is normally an open system because there is a continuous and variable entry and loss of energy and Ecosystem is known by different terms i.e., biogeocoenosis or geobiocoenosis or microcosm or ecosom or biosystem, etc. the whole earth can be called biosphere or ecosphere.
- Ecosystem is composed of a variety of abiotic (non-living) and biotic (living organisms) components that function in an interrelated fashion.
Kinds of Ecosystem
Ecosystem can be classified as:
Natural ecosystem: The ecosystem which are completelydependent on solar radiation e.g. forests, oceans, grasslands,lakes, rivers and deserts. This type of ecosystem is a source offood, fuel, fodder and medicines.
Man-made ecosystem: The ecosystem which are dependent on solar energy, e.g. agricultural fields and aquaculture ponds. Such ecosystems are also dependent on fossil fuels, e.g. urban and industrial ecosystem.

Structure and Function
- Ecosystem is self-sustained functional units.
- The structure of an ecosystem can be expressed by the following terms -
Species compositor: Plant and animal species found in an ecosystem.
Stratification: Vertical layers of plants.
Standing crop: Amount of biomass.
Standing state: Amount of inorganic substances.
Species composition
- It differs from one ecosystem to another dependingupon geography, topography and climate.
- Each ecosystem has a biotic community composed of particular grouping of species.
- Maximum species composition occurs in tropical rainforests and coral reefs. Minimum occurs in deserts and arctic regions.
Stratifications
- Stratification is the occurrence of vertical zonation in the ecosystem & indicates the presence of favorable environmental conditions, for e.g., trees occupy top vertical strata or layer of a forest, shrubs and herbs & grasses occupy the bottom layers.
- Stratification helps in accommodation of large number & types of plants in the same area. It also provide a number of microhabitat & niches for various types of animals.
- It is absent or poor where environmental conditions are unfavorable, e.g. desert ecosystems have very few trees & shrubs.
Standing crop
- Standing crop is the amount of living biomass in an ecosystem. It indicates the productivity & luxuriance of growth.
- It is expressed in the form of number or biomass of organisms per unit area.
- A terrestrial ecosystem with high standing crop possesses a forest while the one with low standing crop occurs in grassland followed by arid ecosystem.
Standing state
- The amount of nutrients, e.g. nitrogen, phosphorus & calcium present in the soil at any given time is known as standing state.
- The proper functioning of an ecosystem takes place through the following processes:
- Productivity
- Decomposition
- Relationship of producers and consumers
- Flow of energy through different trophic levels, and
- Cycling of nutrients.
Productivity
- Productivity refers to the rate of biomass production i.e. the rate at which sunlight is captured by producers for the synthesis of energy rich organic compounds.
- It is of two types - primary productivity and secondary
- Primary productivity is the amount of biomass produced per unit area over a time period by plants during
- It is expressed in terms of weight \[({{g}^{-2}})\] or energy (kcal\[{{m}^{-2}}\]). It is of two types: GPP and NPP.
- Gross primary productivity (GPP) - It is the rate of production of biomass or accumulation of energy by green plants per unit area per unit time. GPP depends on the chlorophyll content.
- Net primary productivity (NPP) - It is the amount of biomass which has been stored by green plants.
- The net primary productivity results in the accumulation of plant biomass, which serves as the food of herbivores & decomposers.
- NPP is equal to the rate of organic matter created by photosynthesis minus the rate of respiration and other
Net primary productivity = Gross primary productivity - Respiration losses, (or GPP-R = NPP)
- Secondary Productivity is the amount of biomass synthesized by consumers per unit area per unit time.
- Consumers tend to utilize already produced food materials in their respiration and also convert the food matter to different tissues by an overall process. So secondary productivity is not divided into ‘gross’ and ‘net’ amounts.
- The annual net primary productivity of the whole biosphere is approximately 170 billion tons of organic matter.
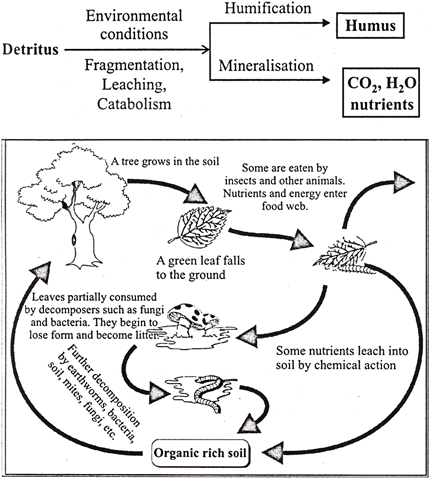
Decomposition
- Decomposition is the breakdown of complex organic compounds of dead bodies of plants and animals into simpler inorganic compounds like\[C{{O}_{2}}\], water & various
- The organisms carrying out decomposition are called
- Decomposers include micro-organisms (bacteria and fungi), detritivores (earthworm) and some
Process of Decomposition
- Decomposition is physical as well as chemical in nature and consists of the following processes:
- Fragmentation: It is the formation of smaller pieces of dead organic matter or detritus by detritivores. Due to fragmentation, the surface area of detritus particles is greatly increased.
- Catabolism: Chemical conversion of detritus into simpler inorganic substances with the help of bacterial and fungal enzymes is called catabolism.
- Leaching: Water soluble substances (formed as a result of decomposition) are leached to deeper layers of soil.
- Humification: If decomposition leads to the formation of colloidal organic matter (humus), the process is called humification. Humus is highly resistant to microbial action and undergoes extremely slow decomposition. It serves as a reservoir of nutrients.
- Mineralisation: Formation of simpler inorganic substances (like\[C{{O}_{2}}\], water and minerals) is termed Mineralisation.
Factors Affecting Decomposition
- The rate of decomposition is dependent on many factors like chemical nature, temperature, availability of oxygen, moisture, etc.
- Chemical nature of detritus: Decomposition of detritus is slow if contains chitin, tannins and cellulose. It is rapid if detritus possesses more of nitrogenous compounds like proteins, nucleic acids and reserve carbohydrates.
- Temperature: At a temperature more than\[25{}^\circ C\], decomposers are very active in soils having good moisture and aeration. In humid tropical regions, it does not take more than 3 – 4 months for complete decomposition of However, under low temperature conditions \[(>10{}^\circ C)\] of soils, the rate of decomposition is very slow even if moisture and aeration are optimum. Because of it, complete decomposition of detritus may take several years or even decades.
- Moisture: An optimum moisture helps in quicker Reduction in moisture reduces the rate of decomposition as in areas of prolonged dryness like tropical deserts where otherwise the temperature is quite high. Excessive moisture also impedes decomposition. It may promote pearl formation.
- Aeration: It is required for the activity of decomposers and detrivores. A reduced aeration will slow down the process of decomposition.
- Soil pH: Detrivores are fewer in acidic soils. Microbial activity is also low in such soils. Detrivores are abundant in neutral and slightly alkaline soils while decomposers microbes are rich in neutral and slightly acidic soil.
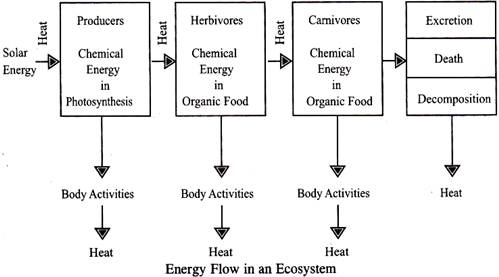
Energy flow
- Energy is the ability to do work. The main source of energy for an ecosystem is the radiant energy or light energy derived from the sun. 50% of the total solar radiation that falls on earth is photo synthetically active radiation (PAR). The amount of solar radiation reaching the surface of the earth is 2 cals/sq.cm/min. It is more or less constant and is called solar constant or solar flux. About 95 to
99% of the energy is lost by reflection. The light energy is converted into chemical energy in the form of sugar by photosynthesis.
\[6{{H}_{2}}O+6C{{O}_{2}}+Light\to 6{{C}_{12}}{{H}_{6}}+6{{O}_{2}}\]
- The rate of energy transfer between elements of an ecological system is called energy flow. The flow of energy is unidirectional in the ecosystem.
- Plants utilize 2-10% of PAR in photosynthesis.
- The energy formed by the green plants (producers) then flows through different trophic levels of ecosystem i.e., primary, secondary and tertiary consumers.
- Producers include green plants which are capable of manufacturing their own food. These are able to fix the energy obtained from the sun. Producers are autotrophic, generally chlorophyll bearing organisms.
- Consumers (photographs) cannot make their own food but are directly or indirectly dependent on producers for obtaining food. Consumers may be:
- Primary consumers or herbivores.
- Secondary consumers or primary carnivores.
- Tertiary consumers or secondary carnivores.
- Primary consumers obtain their food by directly feeding on producers (plants), secondary consumers from primary consumers (herbivores) and tertiary consumers from secondary consumers.
- The conversion of radiant energy of sun into chemical energy and its subsequent transfer to other organisms occurs in accordance with the laws of thermodynamics.
- First law of thermodynamics states that energy is neither created nor destroyed but can be transferred from one component to another. E.g. sunlight energy can be transformed into energy of food & heat.
- Second law of thermodynamics: At each step of energy transformation, there occurs dissipation of energy and increase in disorderliness.
- Trophic structures of ecosystem is a type of producer-consumer arrangements in which each food level is called trophic levels.
- All trophic levels in an ecosystem are connected by transfer of food or energy.
- Two aspects with respect to energy flow in ecosystem are important. First, the energy flows unidirectional i.e. from producers through herbivores to carnivores; it cannot be transferred in the reverse direction. Second, the amount of energy flow decreases with successive trophic levels. Producers capture only a small fraction of solar energy (1 - 5 percent to total solar radiation), and the bulk of initialized energy is dissipated mostly as heat. Part of the energy captured in gross production of producers is used for the maintenance of their standing crop (respiration) and for providing food to herbivores. The unutilized net primary production is ultimately converted to detritus, which serve as energy source to decomposers. Thus, energy actually used by the herbivore trophic level is only a small fraction of energy captured at the producers levels.
- A large amount of energy is lost at each trophic level. It is estimated that 90% of the energy is lost when it is transferred from one trophic level to another. Hence, the amount of energy available decreases from step to step. Only about 10% of the biomass is transferred from one trophic level to the next one in a food chain. And only about 10% chemical energy is retained at each trophic level. When the food chain is short, the final consumers may get a large amount of energy. But when the food chain is long, the final consumer may get a lesser amount of energy.
Food chain
- The ecosystems is characterized by the energy flow and the circulation of material through its members. The different organisms of an ecosystem are linked together by their nutritional requirements. Individual related in this manner constitute a food chain.
- Food chain is an order or sequence of different organisms which are arranged in a way that the food is passed from one type of organism to other organisms such that the organisms of one order or trophic level are the food of the organisms of next order.

- Types of food chains: The food chains are of two types, namely:
(i) Grazing food chain: This food chain starts from plants, goes through herbivores and ends in carnivores.
Plant \[\to \] Herbivores \[\to \] Primary Carnivores \[\to \] Sec. Carnivores.
This type of food chain depends on the autotrophs which capture the energy from solar radiation.
A few chains are given below:
Grass \[\to \] Grasshopper \[\to \] Lizard \[\to \] Hawk
Grass \[\to \] Mouse \[\to \] Snake \[\to \] Hawk
Phytoplankton \[\to \] Zooplankton \[\to \] Fish \[\to \] Snake.
The grazing food chain is further divided into two types, namely: (a) Predator (b) Parasitic.
(ii) Detritus food chain: It starts from dead organic matter and ends in inorganic compounds. There are certain groups of organisms which feed exclusively on the dead bodies of animals and plants. These organisms are called detritivores. The detritivores include algae, bacteria, fungi, protozoans, insects, millipedes, centipedes, crustaceans, mussels, clams, annelid worms, nematodes, ducks, etc.
Difference between Grazing and Detritus food chains
|
|
Grazing food chain
|
Detritus food chain
|
|
1.
|
The chain begins with
Producers as the first trophic level.
|
The chain begins with detritivores and decomposers as the first trophic level.
|
|
2.
|
Energy for the food comes from sun.
|
Energy for the food comes from organic remains or detritus.
|
|
3.
|
Food chain adds energy into the ecosystem.
|
It retrieves food energy from detritus and prevents its wastage.
|
|
4.
|
The food chain binds up inorganic nutrients.
|
The food chain helps in releasing inorganic nutrients to the cycling pool.
|
|
5.
|
It account for less energy flow because most organisms die without having been eaten.
|
Detritus food chain can account for more energy flow.
|
|
6.
|
Cattle grazing in grassland, deer browsing in forest and insects feeding on crops and trees are most common biotic constituents of grazing food chain
|
In the forest, an example of detritus food chain is: detritus \[\to \] Soil Bacteria \[\to \]Earthworms.
|
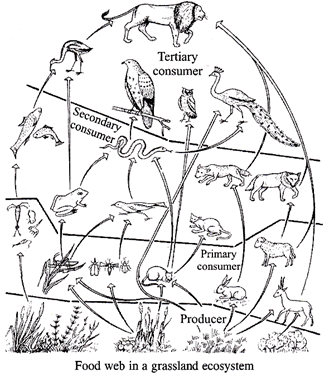
Food web
- Food web refers to a group of inter- related food chains in a particular community. Under natural conditions, the linear arrangement of food chain hardly occurs & these remain indeed inter-connected with each other through different types of organisms at different trophic level.
- Simple food chains are very rare in nature. This is because each organism may obtain food from more than one tropic In other words, one organism forms food for more than one organisms of the higher trophic level.
- Food webs are very important in maintaining equilibrium(homeostasis) of ecosystem.
Example: In a grassland ecosystem
- Grass \[\to \] Grasshopper \[\to \] Hawk
- Grass \[\to \] Grasshopper \[\to \] Lizard \[\to \] Hawk
- Grass \[\to \] Rabbit \[\to \] Hawk
- Grass \[\to \] Mouse \[\to \] Hawk
- Grass \[\to \] Mouse \[\to \] Snake \[\to \] Hawk
- Significance of food web: Food webs are very important in maintaining the stability of an ecosystem. For example, the deleterious growth of grasses is controlled by the herbivores, when one type of herbivores increase in number and control the vegetation.
Similarly, when one type of herbivorous animal becomes extinct, the carnivore predating on this type may eat another type of herbivore.
Difference between Food chain and Food web.
|
|
Food chain
|
Food web
|
|
1.
|
It is a straight single pathway through, which food energy travels in an ecosystem.
|
If consists of a number of food chain through which food energy passes in the ecosystem.
|
|
2.
|
Members of higher trophic level fed upon a single type of organisms of lower trophic level.
|
Members of higher trophic level can feed as a number of alternative organisms of the lower trophic level.
|
|
3.
|
Presence of separate and isolated food chains adds to the instability of the ecosystem.
|
Presence of food web increases the stability of the ecosystem.
|
|
4.
|
It does not add to the adaptability and competitiveness of the organisms.
|
Food web increases adaptability and competitiveness of the organisms.
|
Types of Ecosystems
Ecosystems are of various types including the following:
(I) Terrestrial Ecosystem
(a) Grassland Ecosystem
A grassland ecosystem is the collection of plants, animals and micro-organisms that live within an environment where grasses are the primary form of vegetation. Grasslands cover around 40 percent of the earth's surface, and they exist in both temperate and tropical regions, generally within the dry interior areas of land masses. The amount of rainfall in grassland ecosystems is too little to support many large plants, though some trees do occur.
- In tropical grassland ecosystems, the heavy precipitation of the rainy season follows months of dry heat.
- Temperate grasslands alternate periods of abundance with periods of dormancy when the temperatures are too cold for growth.
- Some grassland ecosystems, such as the savanna or the prairie, produce tall grasses.
- Others, such as the windy steppes, grow very short grasses often less than an inch high.
Examples of grassland ecosystems include the prairies of western North America, the Pampas of Argentina and the Russian steppes.
Grassland ecosystems can support high densities of grazing animals. They are home to many familiar and fascinating species that live in herds, including zebras and antelopes, and the predators that prey on them, like lions and cheetahs.
(b) Forest Ecosystems
Forest ecosystem is the scientific study of the interrelated patterns, processes, flora, fauna and ecosystems in forests. The management of forests is known as forestry, silviculture, and forest management. A forest ecosystem is a natural woodland unit consisting of all plants, animals and micro-organisms (Biotic components) in that area functioning together with all of the non-living physical (abiotic) factors of the environment. Forests accumulate large amounts of standing biomass, and many are capable of accumulating it at high rates, i.e. they are highly productive. Since trees can grow larger than other plant life-forms, there is the potential for a wide variety of forest structures (or physiognomies). The infinite number of possible spatial arrangements of trees of varying size and species makes for a highly intricate and diverse micro-environment in which environmental variables such as solar radiation, temperature, relative humidity, and wind speed can vary considerably over large and small distances.
(II) Aquatic Ecosystem
An aquatic ecosystem is an ecosystem in a body of water.
Communities of organisms that are dependent on each other and on their environment live in aquatic ecosystems. The two main types of aquatic ecosystems are marine ecosystems and freshwater ecosystems.
- Marine Ecosystem: Marine ecosystems cover approximately 71% of the Earth's surface and contain approximately 97% of the planet's water. They generate 32% of the world's net primary production. They are distinguished from freshwater ecosystems by the presence of dissolved compounds, especially salts, in the water. Approximately 85% of the dissolved materials in seawater are sodium and chlorine. Seawater has an average salinity of 35 parts per thousand (ppt) of water. Actual salinity varies among different marine ecosystems. Marine ecosystems can be divided into many zones depending upon water depth and shoreline features:
(1) The oceanic zone is the vast open part of the ocean where animals such as whales, sharks, and tuna live.
(2) The benthic zone consists of substrates below water where many invertebrates live. The intertidal zone is the area between high and low tides; in this figure it is termed the littoral zone.
(3) Neritic zones can include estuaries, salt marshes, coral reefs, lagoons and mangrove swamps.
(4) Abyssal Zone, hydrothermal vents may occur where chemosynthetic sulfur bacteria form the base of the food web.
Classes of organisms found in marine ecosystems include brown algae, dino-flagellates, corals, cephalopods, echinoderms, and sharks.
Sea Life
Sea regions are broadly divided into coral reefs, estuaries and oceans.
- Oceans: They are the biggest and the most varied of the ecosystem. Most of the oxygen in the atmosphere is generated by the algae. Here salt water evaporates and turns to rain which in turn falls on land. Large amount of carbon dioxide is absorbed by the algae in the atmosphere. Inter - tidal zone is the zone which connect ocean to the Only few species exist in rocky coastal areas as very few tides reach there.
- Other oceanic zones: Deep Sea which is also called benthic zone is the host to slit, sand and slowly decomposing organisms. Sunlight does not reach these areas so these areas are very cold. There are only few plants here and animals include starfish, anemones, sponges, amongst others, as well as several micro-organisms. Abyssal zone is the deepest part of the ocean. Fishes such as oddities and many species of invertebrates are found here.
- Coral Reefs: They are the marine ridges and mounds which are formed due to the decomposition of calcium carbonate of living organisms. Coral consist of animal and algae tissues. It is a living organism. Corals use tentacles to catch microorganisms like animals do and feed by the process of photosynthesis like plants. The coral reef is also host to other species such as starfish, octopi and other mollusks. Coral animals cannot live in water cooler than\[65\,\,{}^\circ F\] \[(18\,\,{}^\circ C)\], therefore coral reefs are found mostly in. warm, shallow, and tropical seas.
- Estuaries: Transition area between river and sea is called They are highly productive and rich in nutrients. There are many different names of estuaries like bays, sounds, inlets, harbors, and sloughs.
- Freshwater Ecosystem: Freshwater ecosystems cover 78% of the Earth's surface and inhabit 0.0009% of its, total water. They generate nearly 3% of its net primary production. Freshwater ecosystems contain 41% of the world’s known fish species.
There are three basic types of freshwater ecosystems:
(a) Lentic: slow moving water, including pools, ponds, and lakes.
(b) Lotic: faster moving water, for example streams and rivers
(i) Lentic Zone:
(1) Lake ecosystems: It can be divided into zones. The first, the littoral zone, is the shallow zone near the shore. This is where rooted wetland plants occur. The off shore areas may be called the pelagic zone, the photic zone may be called the limnetic zone and the aphotic zone may be called the profundal zone.
(2) Pond Ecosystem: Ponds are small bodies of freshwater with shallow and still water, marsh, and aquatic plants. They can be further divided into four zones: vegetation zone, open water, bottom mud and surface film. The size and depth of ponds often varies greatly with the time of year; many ponds are produced by spring flooding from rivers. Food webs are based both on free-floating algae and upon aquatic plants.
(ii) Lotic Zone: The major zones in river ecosystems are determined by the river bed's gradient or by the velocity of the current. Faster moving turbulent water typically contains greater concentrations of dissolved oxygen, which supports greater biodiversity than the slow moving water of pools. These distinctions form the basis for the division of rivers into upland and lowland rivers.
Fresh water Life
The name freshwater is due to the less salt content in them. They exist in various forms such as lakes, rivers, ponds, swamps or wetland and are host to wide variety of plants and animals.
- Lakes: Lakes are the water bodies which can exists for centuries other than others like ponds which dry up The littoral zone, which is close to the shore, is host to a extensive range of species due to its warm and shallow environment. Several species of invertebrates, crustaceans, plants and amphibians bloom in this environment and in turn offer food for predators such as birds, reptiles and other creatures inhabiting the shoreline.
- Wetlands: Large variety of flora and fauna grows in other still water bodies or wetlands like swamps, glades and marshes. Trees such as Cypress which are highly adaptable to high humidity of this region also grow in Other plants such as pond lilies and sedges also grow here. Animals found here are different types of reptiles, mammals, amphibians and birds and hundreds of insects. Starting point of rivers and streams are mostly snow and ice melting and spring. At the end, they end up in ocean or in other water body. Flora and fauna are different here from the lakes and ponds as the water is continuously flowing. Depending upon water temperature and the exposure of riverbanks to the sunlight small fishes such as river trout and crayfish can be found in several areas. Salmon and other vigorous fishes can be found in cold areas while fishes like catfish, carp, and other bottom feeders can be found in warm areas which are rich in sediments and decaying matter. River plants comprise floating weeds and algae, mostly found forming around rocks and submerged tree roots.
The area where freshwater meets saltwater, is called an estuary; this area generally features distinctive features, trees and algae, seaweed, wetland flora, and several species of invertebrates, birds, reptiles and crustaceans congregate into a composite ecosystem, serving as a trade center to the world’s aquatic biomes.
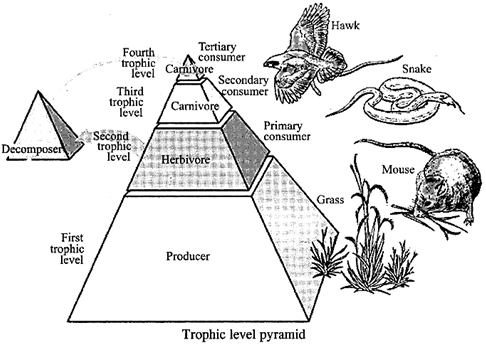
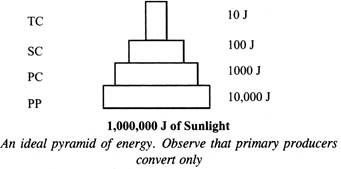
Ecological Pyramids
- The number, biomass and energy of organisms gradually decrease from the producer level to the consumer level. The number of individuals present or amount of biomass synthesized or amount of energy stored at successive trophic levels in an ecosystem can be graphically represented in the form of pyramids. These are called ecological or Eltonian pyramids. The use of ecological pyramid was first described by Charles Elton in 1927.
- In the ecological pyramid, the producer forms the base and the final consumer occupies the apex.
- Three ecological pyramids which are studied are pyramid of number, pyramid of biomass and pyramid of energy.
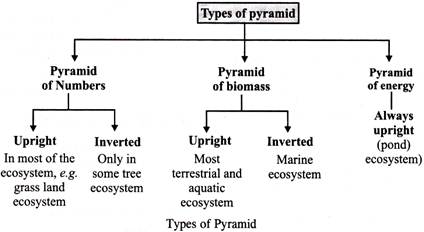
Pyramid of Numbers
- Pyramid of number is usually upright.
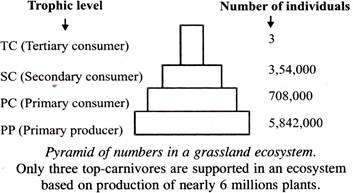
- It is a graphical representation of numerical strength of various populations in different trophic levels per unit area of an ecosystem with producer forming base, intermediate levels forming intermediate tiers & apex formed by top
- In an ecosystem, number of individuals is generally maximum at the producer level. The number of herbivores is lesser than the producers. Similarly, the number of carnivores is lesser than the herbivores. Number of producers per unit area is more in pond ecosystem than grassland ecosystem. In forest ecosystem the pyramid of number is intermediate. Here the number of primary consumers is more than producers as well as top
- In a cropland ecosystem: In croplands the crops are morein numbers. The grasshoppers feeding on crop plants arelesser in number. The frogs feeding on grasshopper arestill lesser in number. The snakes feeding on frogs arefewer in number.
Crop \[\to \] Grasshopper \[\to \] Frogs \[\to \] Snakes \[\to \] Hawks
- In a grassland ecosystem: In a grassland the grasses arethere in large numbers. The consumers decrease in thefollowing order.
Grass \[\to \] Grasshopper \[\to \] Lizard \[\to \] Hawk Grass \[\to \] Rabbit \[\to \] Fox \[\to \] Lion
- In a pond ecosystem: The number in a pond ecosystem decreases in the following order. Phytoplankton \[\to \] Zooplankton \[\to \] Fishes \[\to \] Snakes
- The pyramid of number of a single tree is spindle-shaped.
- Sometimes the pyramid of number is inverted in parasitic food chain.
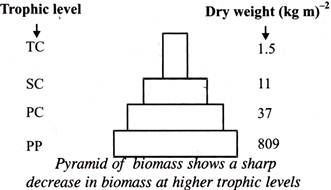
Pyramid of Biomass
- Biomass refers to the total weight of living matter perunit area. In an ecosystem the biomass decreases fromthe producer level to the consumer level.
- Pyramid of biomass of terrestial ecosystem is upright because at each successive trophic level the biomass tends to decrease, starting from primary producers and ending in top consumers.
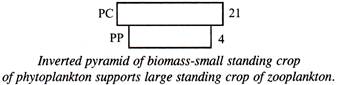
- Pyramid of biomass of aquatic ecosystem is inverted.
- In a grassland: In a grassland the biomass of grasses is the maximum, and it gradually decreases towards the consumer level in the following order.
Grass \[\to \] Mouse \[\to \] Snake \[\to \] Hawk
Grass \[\to \] Grasshopper \[\to \] Lizard \[\to \] Hawk
- In a forest: In a forest the biomass of trees is the maximum and the biomass of the top consumer is the minimum. The decrease in weight occurs in the following order :
Plants \[\to \] Deer \[\to \] Fox \[\to \] Tiger
Plants \[\to \] Rabbit \[\to \] Fox \[\to \] Lion
Pyramid of Energy
- The energy flow in an ecosystem is from the producer level to the consumer level. At each trophic level 80 to 90% of energy is lost. Hence, the amount of energy decreases from the producer level to the consumer level.
- Pyramid of energy is always upright because during the flow of energy from one trophic level to the next one, there always occurs a loss of energy.
- 10 per cent Law: Only 10% of the total energy stored in a trophic level is transferred to the next trophic level of a food chain. This law was given by Lindeman (1942).
- In a grassland: In a grassland green plants trap the maximum light energy. The energy gradually decreases towards the top consumer level.
Grass \[\to \] Grasshopper \[\to \] Lizard \[\to \] Hawk
Grass \[\to \] Rabbit \[\to \] Fox \[\to \] Lion
Grass \[\to \] Mouse \[\to \] Snake \[\to \] Hawk
- In a pond: In a pond maximum energy is trapped by the phytoplankton. Then the amount of energy decreases towards the top-consumer level.
Phytoplankton \[\to \] Zooplankton \[\to \] Fish \[\to \] Snake
Phytoplankton \[\to \] Zooplankton \[\to \] Small fish \[\to \] Large fish
Ecological succession
- Ecological succession is the successive development of different biotic communities at the same site. The communities develop one after another till the development of a community which is near equilibrium with the environmental conditions. This is called climax community.
- Climax community is the stable perpetuating and final biotic community that develops at the end of biotic succession. It has maximum diversity & niche specialization.
- The first biotic community which invades a base area is called pioneer community. It is characterized by high growth rate and short life span.
- The transitional communities which develop during the ecological succession or in between the pioneer and climax community are called serial communities.
Pioneer community
(First biotic community at the base area)
\[\downarrow \]
Seral community
(Various biotic communities that
develops during succession)
\[\downarrow \]
Climax community
(The stable, self-perpetuating &
final biotic community)
- The entire series of communities that is characteristic of given site is called a sere.
Difference between Pioneer community and Climax community
|
|
Pioneer community
|
Climax community
|
|
1.
|
It is the first biotic community which develops in bare area.
|
It is the final biotic community that develops in an area.
|
|
2.
|
It is established over a previously bare area.
|
It occurs over an area previously occupied by several communities.
|
|
3.
|
It consists of a fewer small sized organisms.
|
It consists of numerous large and small sized organisms.
|
|
4.
|
The area is hostile for pioneer community.
|
The area is favorable for the climax community.
|
|
5.
|
Life span is short.
|
Life span is long.
|
|
6.
|
Growth is fast.
|
Growth is slow.
|
|
7.
|
It is soon replaced by the next seral community.
|
It is stable. It is not replaced by any other community.
|
- A sequence of seres is characterized not only by the changes in the set of population present, but also by a progressive increase in the diversity of species and the total quantity of living mass. The sequence of seres for a given region is often fully predictable, both with respect to the general types of population expected at each sere and to seral duration.
Characteristics of Ecological Succession
- Formation of soil, increase in thickness and differentiation of soil.
- Increase in humus content of soil.
- Increase in biomass.
- From small lived plants to long lived plants.
- From unstable biotic community to stable biotic
- From lesser species diversity to higher species diversity.
- Increased niche specialization.
- Development of stratification.
- Succession occurs in both animals and plants communities side by side.
- From simple food chains to complex food chains and formation of food webs.
- From aquatic or arid environment to mesic environment.
Types of Succession
Succession is of two types: Primary and Secondary
- Primary succession: It is the ecological succession occurring in an area where no organisms are found, like bare rocks.
- Secondary succession: This type of succession takes place in those areas where all the previous biotic communities have been destroyed, e.g.- burned forests, flooded fields.
Difference between primary succession and secondary succession
|
|
Primary succession
|
Secondary succession
|
|
1.
|
It occurs in an area which has been bare from the beginning.
|
Secondary succession occurs in an area which has been denuded recently.
|
|
2.
|
Soil is absent at the time of beginning of this succession.
|
Soil is present.
|
|
3.
|
No humus in the beginning.
|
Humus is present before the very beginning.
|
|
4.
|
Reproductive structure of any previous community are absent.
|
Reproductive structures of the previous occupants are present in the area.
|
|
5.
|
Pioneer community comes from the outsides.
|
Pioneer community develops partly from the previous occupants and partly from the migrants.
|
|
6.
|
Many seral community.
|
Few seral community.
|
|
7.
|
Long time for completion.
|
Less time for completion.
|
Succession in plants
- Ecological succession may be of the following types depending upon the climatic conditions of the area where it starts.
- Successions are variously designated as xerosere/lithosere (succession on bare rock), hydrosere (succession in water), psammosere (succession on sand).
Hydrach/Hydrosere Succession
- Hydrosere is a sequence of communities that reflects the developmental stages in a plant succession, which commences on soil, submerged by fresh water.
- Hydrach succession takes place in wetter areas like ponds, lakes etc. and the successional series progress from hydric to the mesic conditions.
Climax forest community (Mesophytic)
(e.g., Tropical rain etc)
\[\uparrow \]
Woodland stage
(e.g., Salix, Almus etc)
\[\uparrow \]
Sedge meadow stage
(e.g., Juncus, Cyperus)
\[\uparrow \]
Read swamp stage
(e.g., Typha, Sagittaria, etc)
\[\uparrow \]
Floating stage
(e.g., Nymphaea, Pistia, Wolffia, Azolla)
\[\uparrow \]
Submerged stage
(e.g., Hydrilla, Elodea, Najas, Chara, etc)
\[\uparrow \]
Pioneer stage
(e.g., Diatoms, bacteria,
dinoflagellates euglenoids, etc)
Structure of hydrosere

Diagram showing different plant communities
appearing at different stages of a hydrosere originating in a pond.
Xerarch Succession
- Xerarch succession starts in dry areas & the series progress from xeric to mesic conditions.
- Stages in xerarch occurring on bare rock is called lithosere.
- Pioneer of this succession depends on climate. In tropical areas the pioneers are cyanobacteria or blue green algae.
In temperate areas, they are crustose lichens.
Climax forest community
(mesophytic)
\[\uparrow \]
Shrub stage
(e.g., Rhus, Phytocarpus)
\[\uparrow \]
Herbaceous stage
(e.g., Eleusine etc)
\[\uparrow \]
Moss stage
(e.g., Polytrichum, Toxila)
\[\uparrow \]
Foliose lichen stage
(e.g., Parmellia, Dermatocarpon, etc)
\[\uparrow \]
Crustose lichen stage (pioneer stage)
(e.g., Rhizocarpous, Rinodina etc)
Flow chart 14.4: The
Structure of lithosere/xerosere
- The ecological succession on bare rocks includes the development of following communities - Crustose lichens \[\to \] foliose lichens \[\to \] mosses\[\to \] grasses \[\to \] shrubs \[\to \] trees.
Nutrient Cycling
- These are the cyclic events by which various nutrients which are essential for the living organisms are transferred from one form to other. During these cycles, the nutrients pass from the biotic components to the abiotic components and vice-versa,; hence these are also called biogeochemical cycles.
- Two types of nutrient cycles are -
(i) Gaseous cycles (nitrogen, oxygen, carbon cycles)
(ii) Sedimentary cycles (phosphorus, sulphur cycles)
- In gaseous cycle, the main reservoirs of chemicals are the atmosphere and ocean.
- In sedimentary cycles, the main reservoirs are soils and rocks.
Carbon Cycle
- Carbon is present in carbohydrates, proteins and fats.
- Carbon is taken up by green plants as \[C{{O}_{2}}\] for photosynthesis.
- Carbon is present as \[C{{O}_{2}}\] in atmosphere, as graphite and carbonates in rocks and also in fossil fuels (coal, petroleum).
- Ocean are big reservoirs of carbon.
- Carbon is released as \[C{{O}_{2}}\] in atmosphere during
- respiration of plants and animals
- burning of fossil fuels
- Carbon is also released in atmosphere as methane by rice fields and marshes.
- Carbon cycle is cyclic representation of carbon assimilation by green plants (photosynthesis) which then passes into bodies of animals (plants are eaten) and finally during respiration of plants & animals & decompositions by microbes, the carbon dioxide is returned back to the atmosphere. Thus, carbon is cycled through transfer and transformation between biotic and abiotic components.

Simplified model of carbon cycle in the biosphere
Phosphorus Cycle
- Phosphorus is an important element for living beings.
- The cycling of phosphorus between biotic & abiotic components of the environment represent phosphorus cycle.
- Phosphorus is present in
- Bio membranes (as phospholipids).
- Nucleic acids (as phosphoric acid).
- Nucleotides (as AMP, ADP, ATP etc).
- Bones and teeth (as hydroxyapatite).
- Consumers obtain phosphorus directly or indirectly from plants.
- Phosphorus is also present in phosphatic rocks.
- Phosphorus is released during the decomposition of plant and animal remains.
- The released phosphorus may reach the deeper layers of soil and gets deposited as phosphate rocks.
- Phosphorus containing rocks are mined for manufacture of fertilizers, which provide an additional supply of an organic phosphates to the abiotic environment.
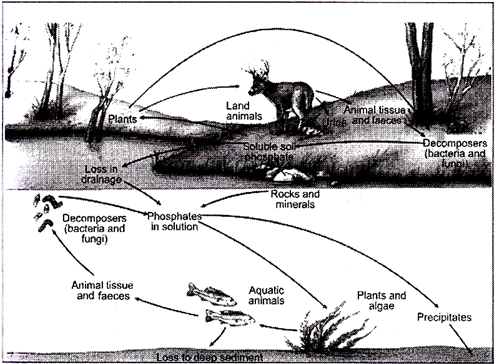
Phosphorus cycle
- All plants and animals eventually die and in due time, their organic remains or debris decay through the action of micro-organism and the phosphates are release into the water for recycling.
BIOMES
Community Ecology or Synecology: Community ecology is a study of pattern and processes involving at least two species on many spatial and temporal scale which include the distribution, structure, abundance, demography, and interactions between coexisting populations.
Biomes: Biome is a part of large ecosystem that have commoncharacteristic due to similar climates and can be found over arange of continent. In other words biomes are largely naturaleco-system wherein we study the total assemblage of plantand animal communities. Though a biome includes both plantand animal communities but a biome is usually identified andearned on the basis of its dominant vegetation. Most of theecologists have recognized at least nine different biomes.
Land biome include tropical rain forest coniferous forest, temperate broad leaf deciduous forest, mediterranean forest, tropical deciduous forest, tropical scrub, grassland, tundra and desert.
- Tropical rainforest: Tropical rainforest are the earth’s most complex biome and have great diversity of plants and animals. It is located between the tropic of cancer and tropic of Capricorn.
- It covers around 5% of the earth's land surface and has 50% of all known species of the earth. These forests have average temperature of \[20-25{}^\circ C\] which can varies throughout the year.
- The primary productivity is high but has low net primary
- The important characteristics of tropical rainforest that has low nutrient in soil but has tight cycling of nutrients, all the nutrients are present in the buttresses of the trees.
- Species diversity is highest in the tropical rainforest. Drip tips facilitate drainage of precipitation from the leaves make it rain even when it is not raining.
- In this forest Strangler are the plants present as an epiphytes in the canopy and send their roots downward to the forest floor. The fig family is well represented among the stranglers.
- Coniferous forest: Coniferous forest is mainly consists of evergreen gymnosperms with needle shaped leaves. It is the largest biome on the Earth. Soil of the forest is thin, nutrient poor and acidic as conifer needles get decomposed here and bacterial activity is slowed down at lower pH.
- Precipitation is primarily in the form of snow 40 – 100 cm annually and temperature ranges from \[0{}^\circ C\] to
\[5{}^\circ C\].
- There are two types of Coniferous trees: Northern Boreal Forest and Temperate Coniferous Forest.
- Northern Coniferous Forest: South of the tundra and to the north of deciduous forests & grasslands between \[50{}^\circ C\] to \[60{}^\circ C\] N latitude in Canada Europe.
Temperate Coniferous Forest: Lower latitude of North America, Europe and Asia in high elevation of mountain.
- Temperate Broadleaf Deciduous Forest: Such type of forest is mostly found in western and central Europe Eastern Asia and eastern North America.
- The stratum in the forest is trees, understory shrubs, herbaceous sub-stratum and ground layer.
- Broadleaf forest has moderate to high rainfall and temperature, and the average precipitation being 700mm and average temperature being\[10.8{}^\circ C\]. Broadleaf trees are dominated with trees such as Oak, Maple and Fagus etc.
- Mediterranean Forest: Located in the west coastal regions between \[30{}^\circ \] and \[40{}^\circ \] North and South latitude (mild temperate region) usually surrounded by desert and grassland.
- Mediterranean forest has hot and dry season in the summer, and cool and moist winter season. Average precipitation is 262 mm and average temperature in the forest is\[14.7{}^\circ C\]. In such forest plants moves to the dormant condition during dry summer and spiny shrub dominate at that time.
- Tropical deciduous Forest or Tropical dry Forest: Such types of forest are found on the fringes of the tropical rainforest.
- These forests rank second after tropical rainforest in species richness. Common tree species are Shorea robusta, Tectona grandis, Hopea odorata and Dipterocarpus indicus etc.
- Tropical scrub: Such forest has low tree vegetation type that grow in hot somewhat dry to semiarid lowlands between desert and Savanna on the one hand and tropical deciduous forest and tropical rain forest on the other hand.
- The Grassland: It is found in all ranges of climate from mesic to xeric and from cold to warm condition. Theyare generally open and continuous in fairly flat areas dominated by grasses.
- Such grassland experience wide range of temperature from about \[-20{}^\circ C\] to \[30{}^\circ C\] in extreme winter and warm summer.
- Temperate grassland: Such types of grassland have cold winters and warm summers. Summer temperature ranges to \[38{}^\circ C\] in summer and as low as \[-40{}^\circ C\] in winter. Various species of grassland which include purple needle grass, blue grass, and buffalo grass are found here. Located between temperate forest at high latitude and desert at subtropical latitude and nown by different names in different parts of the world as:
- The Prairies of the great plains of North America
- The Pampas of South America
- The Veldt of South Africa
- The Steppes of Central Euraisa
- The Savanna in Africa
- Tundra: Tundra is the world coldest and driest biome. This type of biome is totally snow covered vegetation at mountain tops.
- Soils are rich in organic matter due to slow decomposition rate and it is also one among the earth’s three major carbon dioxide sink. There are three types of tundra- 1. Arctic Tundra 2. Antarctic Tundra 3. The Alpine Tundra
- Desert: Desert biome is the driest of all the biome and is located at \[30{}^\circ \]North & South and cover about one fifth of the earth’s surface.
- Most of the desert receive about 250 mm of rain. Due to poor canopy and sparse distribution of plants. The leaf area index is less than one and productivity is also less.
- Most of the desert receive about 250 mm of rain per year as compared to rainforest which receive over 2,000 mm. The largest desert on Earth is Antarctica. They are classified into:
- Arid deserts: these types of deserts are found in
North-America, South-America, Africa, and Southern Asia where there is low latitudes. Here generally the temperature is hot and dry with few occurrence of rainfall in winters. In daytime it is very hot as there are no clouds to cover the earth. The soil here is mostly sand or coarse and rocky. Here, vegetation is mostly shrubs and small trees and leaves are adapted to retain water. The animals are generally active during night.
- Semi-arid deserts: These deserts arc found in North-America, Europe, Russia and Northern Asia. Here also there is low rainfall during winters. Here animals can be found in daytime but under the tress or shades.
- Coastal deserts: These deserts are found in areas which are warmer to cooler such as in Neotropic and Nearctic area. Here, the summers are long and warmer while the winters are short and cold. The sand consists of alkaline and the soil is porous so that rain water can enter the ground. Mostly the vegetation here is thick foliage with good water retention quality. The roots of these plants re near to the surface so that they can get water before water drains to the soil. Animals of these deserts comprise rough skinned amphibians, birds of prey, scavenger mammal’s reptiles and insects. Animals here are largely nocturnal during the warmer months.
- Cold deserts: They are the deserts which occur mainly in the cold regions. Here the temperature during the warmest month is\[10{}^\circ C.\] they are mostly covered with snow and ice and due to this they do not support life. Animals in the cold desert are burrowers, even the carnivores and reptiles, which even though cold-blooded, have made their homes in the cold desert. Antarctica is the largest cold desert.
Ecology is the study of interaction among organisms and between the organisms and their abiotic or physical environment.
The ecology is concerned with the following 4- levels of the biological organization.
- Organism level
- Population level
- Community level
- Biome level
This chapter is dedicated to the first 2- levels of the biological organization, i.e., Organisms and Populations
At ‘organism level’ we will study adaptations of the organisms to their environment. The adaptation may be for their survival or for the process of reproduction. Such an aspect of ecology is called ‘Physiological ecology’. The seasonal variation of temperature and precipitation (including rain, snow and sleet etc.) are responsible for the formation of major biomes like. Rain forest, Deciduous forest, Desert, Tundra and Sea coast etc. The local variations (Physical or chemical) in each biome further differentiate various habitats like, polar regions, high mountain tops, rain soaked forests (Meghalaya), Rajasthan deserts, ocean trenches and hot springs etc.
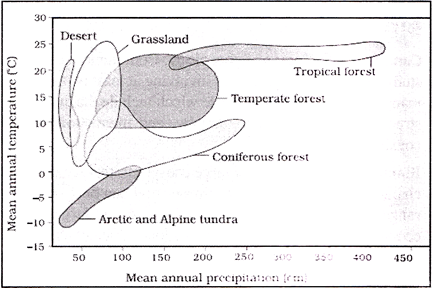
Major Biomes of India with respect to annual temp. and precipitation
- Each habitat comprises both of abiotic and biotic components .The most important abiotic components (physical or chemical) that characterize various habitats include- temperature, light, water and soil. The biotic component that interact with the organisms include mainly pathogen, parasites, predators and competitors. Over a period of time the organisms evolve through natural selection to optimize their survival and reproduction in a given habitat
Populations or Attribution of Population
The population is a group of individuals of a particular species, which potentially interbreed and live in a well-defined geographical area, and also share or compete for similar resources.
For ecological point of view a group of asexual individuals is also known as population.
Examples of populations are
- Tigers in a national park
- Rats in an abandoned building
- Lotus plants in a pond
- Teak-wood trees in a forest
- Bacteria in a petri-dish
The natural selection also operates at population level.
The population has certain attributes or peculiar features whichare not represented by the individuals. The important attributesare Life expectancy, sex ratio, birth rate, death rate, agedistribution etc.
Birth or Natality rate - It is the number of births per thousand of a population per year. It can also be represented in percentage, or per capita, i.e., per individual. If there were 50 lotus plants in a pond last year. This year the population has increased to 58 due to reproduction, then birth rate per capita can be calculated a
58 – 50 = 8
8/50 = 0.16 offspring per lotus per year
Or per capita birth rate per year = 0.16
Death or Mortality rate - It is the number of deaths occurring in a population of one thousand per year.
This can also be represented in percentage or per capita. If in a population of 50 house flies, 5 died in a week, then the per capita death rate per week can be calculated as 5/50 = 0.1
Life Expectancy - It is the length of time for which an individual of a given species can expect to live. It is the characteristic of a population, but not of a species. It is defined as the age at which half the population still survives\[({{M}_{50}})\]. The life expectancy differs with sex and time period. In US females the life expectancy \[({{M}_{50}})\] was 58, 76 and 81 in the years 1900, 1960 and 1980 respectively.
- (Life Span - It is the maximum number of years a member of a species has been known to survive. The life span of human is estimated to be 121 years. The (maximum) life span is the characteristics of a species. In Drosophila, Domestic dog and Tortoise the life spans are 3 months, 20 years and more than 150 years respectively.)
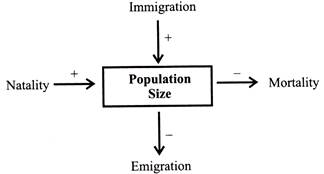
- Population growth - The gross value of population growth is calculated as the difference of birth rate and death rate.
- Dispersal - The movement of the individuals in or out of the population affects the size of population. The movement of individuals into a population is called Immigration, and movement, out of the population is called Emigration.
- A set of local populations connected by dispersing individuals is called a Metapopulation.
- The accurate population growth involves migrant individuals also, which means the –
- Population growth = (Birth rate + Immigrants) – (Death rate + Emigrants)
- Zero Population Growth - When birth rate equals death rate, and the growth of the population is Zero, i.e. the size of the population remains constant, it is called Zero Population Growth or Demographic Transition. Considering migration, at zero population growth :
- Birth rate + immigrants = Death rate + emigrants
- Bio-Index number - It is the ratio of birth rate to the death rate. In case of Zero population growth the bio-index number is one
|
\[Bio-index\text{ }number\text{ }=\frac{Birth\,\,rate}{Death\,\,rate}\]
|
- Population size: The population size may range from few individuals to millions depending upon species, geographical area, impact of predators, outcome of competition and effect of pesticides etc. Sometimes the population size is either too big to measure or meaningless, then the size is more technically called as population density.
- The population density can be defined as the number of individuals per square unit area (in terrestrial organisms) or per cubic unit area (in aquatic or aerial organisms). Sometimes the population density is not required and only Relative density serves the purpose. For example, the fish caught per trap in a lake can be used as population density.
- If we compare about 200 Parthenium plants with one huge Banyan tree, the population density too becomes less useful. In such cases the Biomass or percent cover is used for the measure of population size. In some cases the organisms cannot be seen or counted directly, then the population size is measured indirectly from faecal pellets or pug marks etc.
- Sex ratio - It is the number of females per thousand of males. According to 2001 census it was 933.
- Age and Sex structure - It is the proportion of individuals of different age and sex. It is depicted in pyramidal form plotting percentage of population of each sex in each age-class.
- In developing countries, like India, it is less steep as it has a larger number of younger people. In developed countries it is steeper which represents nearly stable population.
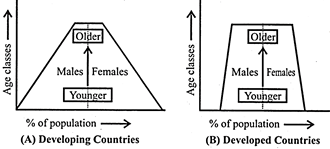
Age sex ratio in (A) Developing Countries and (B) Developed Countries
Age distribution Pyramids - For constructing age pyramids, 3 – age groups are taken into consideration.
- Pre-reproductive age (0 – 14 years)
- Reproductive age (15 – 60 years).
- Post reproductive age (> 60 years).
There are 3-types of pyramids, i.e. 1. Triangular, 2. Bell shaped and 3. Urn-shaped
- Triangular Pyramid – It indicates expanding population with high growth rate.
- Bell shaped Pyramid - It indicates stable population with Zero growth rate
- Urn-Shaped Pyramid - It indicates declining population with growth rate in minus.
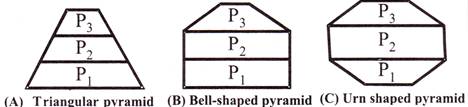
\[{{P}_{1}}\]= Pre-reproductive age, \[{{P}_{2}}\]= Reproductive age, \[{{P}_{3}}\]= Post reproductive age
Population growth: The population density is not a static parameter and keeps changing in times. The population size depends on the availability of food, weather conditions, predation pressure etc.
The population size or density in a given area or habitat, during a given period depends upon the 4 – basic processes
- Natality (B) 2. Mortality (D) 3. Immigration (I)
- Emigration (E)
If N is the population density at time t, then density at time (t + 1) will be
N (t + 1) = N(t) + [ (B + I) - (D + E)]
Until and unless a new habitat is being colonized, the birth and death are the most important factors for influencing the population density.
Growth Models
The growth of population with time shows specific and predictable patterns. The 2-common patterns are
- Exponential or geometric growth pattern
- Logistic growth pattern
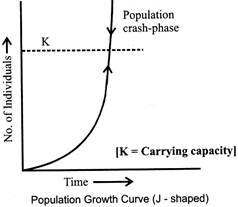
- Exponential growth
When resources like food and space etc. in a habitat are unlimited, each species realizes its full reproductive or biotic potential and grows in an exponential or geometric fashion. For example if a reindeer population (N) is allowed to grow in a predator free environment, the population in time 't' grows beyond carrying capacity and forms ‘J’ shaped growth pattern/curve. Such growth also occurs in algal bloom, insects during rainy season and Paramecium (doubling every day)
Thus under unlimited resources and absence of check any species can grow exponentially. Even the slowest breeder, elephant (gestation period 1 – 22 months) can grow to enormous number.
If the population size is 'N' and birth rate and death rate per capita are respectively 'b' and 'd', then the change in population size, i.e., increase or decrease during a unit time period 't' , will be
\[\frac{dN}{dt}=(b-d)\times N\]
If (b - d) = r, then \[\frac{dN}{dt}=rN\]
Here 'r' is called 'Intrinsic rate of natural increase' or Biotic potential (maximum capacity of reproduction), which indicates the impact of biotic and abiotic factors in population growth. The value of 'r' for human population, in 1981 in India was 0.02.
The integral form of exponential growth equation is
\[Nt={{N}_{0}}{{e}^{rt}}\]
\[Nt=\] Population density after time‘t’
\[{{N}_{0}}\] = Population density at time zero, ‘0’
r = Intrinsic rate of natural increase j
e = the base of natural logarithms (2.718.)
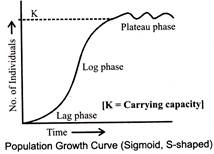
- Logistic growth
In nature no species has unlimited resources at its disposal to permit exponential growth. There starts competition between individuals for limited resources. The population growing in a habitat initially shows 'lag phase', followed by phases of acceleration or deceleration (log phase) and finally the stage of asymptote- when population density reaches carrying capacity (plateau phase or stationary phase).
If the population density 'N' is plotted against time‘t’ the result is 'S' shaped growth pattern/curve (Sigmoid curve).
This type of growth pattern is also called as 'Verhulst-Pearl logistic growth' and can be represented as following equation
\[\frac{dN}{dt}=rN\left( \frac{K-N}{K} \right)\]
K = Nature's carrying capacity in that habitat
(K - N)/ K or 1- N/ K = environmental resistance
Carrying capacity (K) - It can be defined as the maximum number of individuals which the environment can support or sustain. Hence, it is the capacity of environment and not of individuals.
The carrying capacity of the environment depends upon 3-components, i.e.
(i) Productive system - It includes cropland, orchard etc. to provide food and fibres.
(ii) Protective system - It includes forest, ocean etc. which regulate temperature and humidity.
(iii) Waste assimilative system - It includes the generation of waste material in water, air and soil.
Environment resistance - The factors like predators, diseases, calamities, shortage of food etc. which impose a check on population, form environmental resistance. Since resources for growth, for most of animal populations, become sooner or later limited, the logistic growth model is considered to be the more realistic one.
Variations in life history of organisms
The populations evolve to maximize their reproductive fitness with high 'r' value, in the given habitat. This, organisms do by developing the most efficient reproductive strategy under the given selection pressure. For example, the organisms like Bamboo and pacific salmon fish, breed only once in their life time, while others, like birds and mammals breed many times in their life time. Some organisms (Oysters) produce a large number of small sized off springs while others (Birds and mammals) produce a small number of large sized off springs. Thus the organisms maximize their reproductive fitness in the desirable way. This also shows that life history traits have perhaps evolved in relation to constraints imposed by the biotic and abiotic components in their habitat.
Population interactions
In nature no species can survive in isolation. Even the plant species, which can synthesize their own food, cannot survive alone. They need soil microbes to break down the organic matter in the soil and return the inorganic nutrients for absorption. Besides, plants also need animals (insects) for pollination. Thus in nature, plants, animals and microbes do not and cannot live in isolation but interact in various ways to form biological community. The interspecific associations arise from the interaction of populations of different species. Such associations can be beneficial, harmful (detrimental) or neutral (neither beneficial nor harmful).
Following are different interspecific associations/ interactions. The '+' indicates beneficial interaction, '--' detrimental and '0' neutral interaction.
Population Interactions
|
S. N.
|
Name of interaction
|
Species A
|
Species B
|
|
1
|
Parasitism
|
+
|
\[-\]
|
|
2
|
Commensalism
|
+
|
0
|
|
3
|
Mutualism
|
+
|
+
|
|
4
|
Predation
|
+
|
\[-\]
|
|
5
|
Competition
|
+
|
\[-\]
|
|
6
|
Amensalism
|
\[-\]
|
0
|
Parasitism
In this interaction one species (Parasite) is benefitted and the other (Host) is harmed (+, -). The parasitism ensures free lodging and free meals. Many parasites are host specific while others can parasitize on various species of host. The hosts evolve special mechanisms to reject or resist the parasite. The parasite on the other hand evolves the mechanisms to counteract and neutralize their effects. The parasites have following types of special adaptations for their survival
- Loss of unnecessary sense organs
- Presence of suckers or adhesive organs to attach to the host body
- Loss of digestive system
- High reproductive capacity
- Complex life cycle with one or two hosts
Majority of the parasites harm the hosts by reducing their growth, reproduction, survival and population density. They may also make the host physically weak and vulnerable to predation. The parasites can be of 3-types
- Ectoparasite 2. Endoparasite
- Brood parasite
Ecoparasites
The ectoparasites live or feed on the external surface of the host. The most familiar examples are lice and bed bug on human, tick on dogs and leech on cattle. The mosquitoes cannot be considered as true ectoparasites, since they take only meal from the host-body, and do not make lodging. Amongst plants the common example is Cuscuta, which has lost both chlorophyll and leaves during evolution and parasitizes hedge plants. The other parasites are copepods, Petromyzon and hagfishes, for which the hosts are marine fishes.

Endoparasites
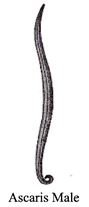
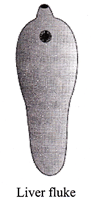
The endoparasites live inside the body of the host. Their morphological and anatomical features are greatly simplified, but their life cycles are more complex because of their extreme specialization. Their reproductive potential is very high. They can be monogenetic (involving single host) or digenetic (involving two hosts). The common monogenetic endoparasites are Ascaris (round worm) and Entamoeba in small and large intestine respectively. The familiar digenetic endoparasites are Taenia (tape worm) and Fasciola (liver fluke) in intestine and liver respectively. The plasmodium is also a digenetic endoparasite in human and female Anopheles mosquito. The filarial worm is similarly a lymph parasite.
Brood Parasites
The koel or cockoo is a brood parasite and lays the eggs in the nest of the host, crow, who incubates them. The eggs of the parasitic bird has evolved resemblances with the host's eggs in colour and shape and size.
Commensalism
In this interaction one species is benefitted and other is neutral i.e., neither benefitted nor harmed (+,0). The association of 'egret and the cattle' is the classical example of commensalism. As the cattle move during grazing, they stir up and flush out the insects from the vegetation which otherwise be difficult for the egret to find and catch. Here the cattle gets no benefit from egret. The other examples of commensalisms are 'clown fish hiding in the colony of sea anemone', 'orchid growing as an epiphyte on mango tree' and the 'barnacle growing on the back of whale'. Here, sea anemone, mango tree and whale derive no benefit from the association.


Mutualism
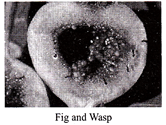
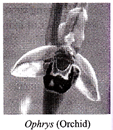
In this interaction both the species are benefitted (+, +). Lichens is such relationship between fungus and photosynthetic algae/ cyanobacteria. The Mycorrhizae is also a similar association between fungus and the roots of higher plants. The fungi here, helps the plant in absorption of essential nutrients from the soil, while plant provides the food to the fungus. In plant-animal association there has occurred co-evolution of mutualism. In many species of fig trees there is a close one-to-one relationship with the species of wasp, for pollination. The female wasp pollinates the fig inflorescence while searching for suitable site for egg laying (oviposition). She lays the eggs inside the fruit and the seeds of the fruit are also consumed by the developing larvae of the wasp. Thus, both are mutually benefitted. Some plants have evolved special structures for pollination by insects like bees, butterflies and bumble bees. To ensure guaranteed pollination the Mediterranean orchid (Ophrys) employs sexual deceit, in which one petal of the flower resembles very closely with the female of the bee in shape, colour and markings. The male bee perceives that petal as female bee and attempts pseudocopulation with the flower and during the process. Ac pollen grains are dusted over the body of male bee. When the same bee pseudocopulates with other flowers, the pollen grains are transferred to them. Thus pollination occurs. This is a fascinating example of co-evolution in orchid and the bee maintaining the close relationship in colour pattern, shape, size and marking.
Predation
Like parasitism, in this interspecific interaction also one species is benefitted and the other is harmed (+, -). The common examples of predator and prey are. Tiger and deer, cat and mouse, and lion and zebra. In a broader ecological sense the sparrow feeding on seed, or the herbivorous animals eating plants, are also predators. The predators have following important roles in the community.
- They (herbivores) act as a conduit for transferring energy, fixed by plants, to higher trophic levels.
- They keep prey population under check. Otherwise, the prey may achieve high population density to make the ecosystem unstable.
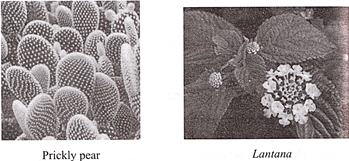
(Whenever an exotic species is introduced into a new geographical area, the species grow exponentially in the absence of natural predators. The following examples of exotic or alien species will support the above statement. Introduction of prickly pear (cactus) into Australia; Nile perch into lake Victoria (East Africa) and Eicchornia into water bodies in India. The other examples of exotic species that spreaded rapidly due to absence of predators are Parthenium, Lantana and Glorias etc.)
- Predation also reduces competition amongst preys species and maintains species diversity. (When Pisaster (star fish), a predator, was removed from American pacific; coast, about 10 species of invertebrates got extincted because of interspecific competition).
If a predator however, overexploits the prey, the prey might become extinct, following which the predator may also become extinct due to lack of food. In nature this is a rare event.
The prey species have evolved various defence mechanisms to lessen the impact of predation. They either run away or have poison secretion/ stings, warming colouration and distasteful nature in various insects or show camouflage (insects, frogs).
The herbivores are plant predators. Amongst insects about 25% are phytophagous. But unlike animals the plants cannot run away from predators and therefore, have evolved varieties of morphological and chemical defenses against herbivores. The common examples of morphological defense are thorns in Acacia and Cactus, while chemical defenses against herbivores, grazers or browsers, are secretion of nicotine, caffeine and quinine in Tobacco, coffee and Cinchona respectively, and cardiac glycosides in Calotropis.
Competition
It is defined as an interspecific process in which the fitness ofone species (measured in terms of 'r') is significantly lower in the presence of another species. It is (–, –) relationship.Charles Darwin also considered the interspecific competitiona potent force in organic evolution. The competition generallyoccurs when closely related species compete for the same butlimiting or depleting resources.
However, competition may also occur between totally unrelated species for the same resource. For example, the Flamingos (birds), visiting S. American lakes, compete with the resident fishes for the common food, zooplanktons.
The competition may ever occur when resources like food and space etc. are abundant, since the feeding efficiency of one species may be reduced due to interfering presence of other species. This competition is called interference Competition. Gause's 'competition exclusion principle' states that two closely related species competing for the same resource cannot co-exist indefinitely and the competitively inferior will be eventually eliminated. This is, however, true only when resources are limited. The species facing competition may sometimes evolve such mechanisms that promote co-existence rather than exclusion. One such mechanism is ‘Resource partitioning’, i.e., avoiding competition by either choosing different timings of feeding or behavioural differences in feeding pattern. In nature the tortoise of Galapagos Islands became extinct within decade after goats, competitively superior, were introduced on the island, due to greater browsing efficiency of the goat. It has also been found in nature that when a competitively superior species is experimentally removed, a species whose distribution is restricted to small geographical area expands its distribution range dramatically and expands into a larger area (Competitive release)
Amensalism
In this association one species is harmed but the other remains neutral (-, 0). For example the fungus, Pemcillium notatum growing close to bacteria, like Staphylococcus, kills the bacteria due to the secretion of penicillin, whereas the fungus remains unaffected. Similarly the leaves falling from the tree either kill or adversely affect the growth of the seedling population underneath the tree.
Ecological Indicators
Ecological indicators are used to communicate information about ecosystems and the impact human activity has on ecosystems stems to groups such as the public or government policy makers. Ecosystems are complex and ecological indicators can help describe them in simpler terms that can be understood and used non-scientists to make management decisions. There different types of ecological indicators:
(a) Keystone Species: A keystone species is a species that has a disproportionately large effect on its environment relative to its abundance. Such species are described as playing a critical role in maintaining the structure of an ecological community, affecting many other organisms in an ecosystem and helping to determine the types and numbers of various other species in the community.
(b) Umbrella Species: Umbrella species are species selected for making conservation-related decisions, typically because protecting these species indirectly protects the many other species that make up the ecological community of its habitat. Species conservation can be subjective because it is hard to determine the status of many species.
(c) Flagship Species: The concept of flagship species has its genesis in the field of conservation biology. The flagship species concept holds that by raising the profile of a particular species
Ecosystem Services
- Human beings benefit from a multitude of resources and processes that are supplied by natural ecosystem. Collectively, these benefits are known as ecosystem services, for example, healthy forest ecosystems purify air and water, migrate droughts and floods, cycle nutrients, generate fertile soils, provide wildlife habitat, maintain biodiversity, pollinate crops, provide storage site for carbon and also provide aesthetic, cultural and spiritual values.
- Services can be subdivided into 5 categories -
(i) Provisioning: Such as the production of food and water.
(ii) Regulating: Such as the control of climate and disease.
(iii) Supporting: Such as nutrients cycle and crop pollination.
(iv) Cultural: Such as spiritual and recreational benefits, and
(v) Preserving: Which includes guarding against uncertainty through the maintenance of diversity.
Importance of ecosystem
Ecosystem play very important role for the survival of different species and their surroundings altogether.
- Energy: Study of ecosystems provides information about harvesting ability and availability at various levels.
- Biogeochemical cycling: Density of ecosystem is governed by degree of biogeochemical cycling and the amount of inorganic nutrients entering the ecosystem from outside.
- Food webs: Each ecosystem has a number of food webs. The knowledge of food webs is helpful to restore a degraded ecosystem and prevent unscientific exploitation of different ecosystems.
- Protection: Each ecosystem whether natural or man-made requires protection from pollutants and pests.
- Inter-relationships: Study of ecosystems gives information about inter-relationships amongst various types of organisms as well as between organisms and their abiotic environment.
- Carrying capacity: By knowing the carrying capacity of ecosystem, it can be known as to what is the number of producers and consumers which can be supported by that ecosystem.
- Inputs: The shortage on inputs can be known and corrected.


