Short Notes - Indian Economy
Category : UPSC
Indian Economy
Introduction
- It's a developing economy with agriculture being its backbone.
- A mixed economy where both public and private ownership prevail.
- World's fourth largest in terms of real GDP after USA, China and Japan.
- Estimated to be third largest economy with a GDP size of $15 trillion by 2030.
Features
- Low per capita income
- Heavy Population Pressure
- Pre-dominance of Agriculture
- Unemployment
- Low Rate of Capital Formation
- Poor Technology
- Backward Institutional and social
- framework
- Under-utilization of Resources
- Price instability
- Dependence on Imports
- Income Disparities
- Poverty
History of Planing in India
- 1934: First attempt to initiate economic planning in India was made by Sir M.Visvesvarayya, through his book 'Planned Economy For India'.
- 1938; 'National Planning Commission' was set up under the chairmanship of L. Nehru by the Indian National Congress.
- 1944: 'Bombay Plan' was presented by 8 leading industrialists of Bombay.
- 1944: 'Gandhian Plan' was given by S. N. Agarwal.
- 1945; 'People's Plan' was given by N.Roy.
- 1950: 'Sarvodaya Plan' was given by P. Narayan. A few points of this plan were accepted by the Government.
The Planning Commission
- It was set up on March 15, 1950 under the chairmanship J.L. Nehru, by: a resolution of Union Cabinet.
- It is an extra-constitutional, nonstatutory body.
- Prime Minister is the ex-officio Chairman, one deputy-Chair appointed by the PM and some full time members.
- On May 29 ,2014, according to reports of IEO, Planning Commission submitted to PM Modi, Planning Commission to be replaced by "Control
- Commission".
- In January 2015, Cabinet resolution replaced the Planning Commission by NITI Aayog.
Plans
First Plan (1951 - 56)
- Based on Harrod-Domar Model.
- Community Development Program launched in 1952
- Focus on agriculture, price stability, power and transport.
Second Plan (1956 - 61)
- Also called Mahalanobis Plan.
- Focus - rapid industrialization
- Target Growth: 4.5% ; Actual Growth: 4.27%
Third Plan (1961-66)
- Target Growth: 5.6% ; Actual Growth: 2.4%
- Agriculture was given to priority to support the exports and industry.
- Aimed to make India a 'self-reliant and 'self-generating' economy.
- Complete failure in reaching the targets due to unforeseen events Chinese aggression (1962), Indo-Pak war (1965), severe drought 1965-66,
Three Annual Plans (1966-69) Plan holiday for 3 years
- The main reasons for plan holidays were the war, lack of resources, and increase in inflation.
- Equal priority was given to agriculture, its allied activities, and industrial sector.
- During the Annual Plans, the economy absorbed the shocks generated during the Third Plan.
Fourth Plan (1969 - 24)
- Target growth rate was 5.6%, actual growth rate was 3.3%.
- Main emphasis was on growth rate of agriculture to enable other sectors to move forward
Fifth Plan (1974-79)
- The fifth plan was prepared and launched by D.D. Dhar.
- Target growth rate was 4.4% and the actual growth rate was 5.0%.
- Expansion of tourism.
- It proposed to achieve two main objectives: 'removal of poverty' (Garibi Hatao) and 'attainment of self-reliance'.
- The plan was terminated in 1978 (instead of 1979) when) anta Party Govt. rose to power.
Rolling Plan (1978-80)
- There were two Sixth Plans. Janta Government put forward a plan for 1978-1983. However, the government lasted for only 2 years. Congress Govt. returned to power in 1980 and launched a different plan.
Sixth Plan (1980 - 85)
- Target growth rate was 5.2% and the actual growth rate was 5.4%.
- It was a great success and marked the beginning of economic liberalisation.
- Focus - Increase in national income, modernization of technology, ensuring continuous decrease in poverty and unemployment, population control through family planning, etc.
Seventh Plan (1985 - 90)
- Target growth rate was 5.0% and the actual growth rate was 6.01%,
- Focus - rapid growth in rood-grains production, increased employment opportunities and productivity within the frame-work of basic tenants of planning.
Eighth Plan (1992 - 97)
- It was postponed by two years because of political uncertainty at the Centre.
- Modernization of industries was a major highlight.
- Main economic outcomes were rapid economic growth, high growth of agriculture and allied sectors, and manufacturing sector, growth in exports and imports, improvement in trade and current account deficit.
- Target growth rate: 5.6%; Average growth rate: 6.78%
Ninth Plan (1997- 2002)
- Target growth was 7.1% and the actual growth was 6.8%.
- It was developed in the context of four important dimensions: Quality of life, generation of productive employment, regional balance and self-reliance.
Tenth Plan (2002 - 2007)
- Target growth: 8.1%
- Growth achieved: 7.7%
- 20 point program was introduced.
- It targetted a GDP growth of 8% per annum.
- Reduction in gender gaps in literacy and wage rates by at least 50%
- Providing gainful and high-quality employment at least to the addition to the labour force.
- Reduction of poverty rate by 5%.
Eleventh Plan (2007 - 2012)
- Accelerate GDP growth from 8% to 10%.
- Reduce Total Fertility Rate to 2.1
- Increase agriculture growth to 4%.
- Emphasis on social sector and delivery of service therein.
- Empowerment through education and skill development.
Twelfth Five Year Plan (2012-2017)
Major objective: Faster, Sustainable and More Inducive Growth.
- Planning Commission in its meeting held on April 2011, the Prime Minister, Dr. Manmohan Singh, addressed the Planning Commission concerning the twelth Five Year Plan of India. The main points of the Twelfth Plan are:
- Resource Allocation
- Priorities in 12th plan
- Health and Education received less than projected in Eleventh Plan. Allocations for these sectors will have to be increased in 12th plan.
- Health, Education and Skill Development together in the Centre's Plan will have to be increased by at least 1.2% point of GDP.
- Infrastructure, including irrigation and watershed management and urban infrastructure, will need additional 0.7 percentage point of GDP over the next 5 years.
- PPP model must be encouraged, including in the social sector, i.e. health and education. Efforts on this front need to be intensified.
- Distinction between plan and non-plan being reviewed by Rangarajan Committee.
|
Important Points
• Planning Commission has been replaced by NITI Aayog.
• Montek Singh Ahluwalia was the last Deputy Chairman of the Commission (resigned on 26 May 2014).
• Five-Year Plans (FYPs) are centralized and integrated national 'economic programs.
|
National Income of India
- National Income is the money value of all the final goods & services which produced by a country during one year.
- India is now the world's 3rd largest economy in terms of real prices and purchasing power.
- For national income, the Indian economy is divided into 14 broad sectors which are grouped into 3 main categories.
|
Sector
|
Activity
|
|
Primary Sector
|
Agriculture and Allied Sector
|
|
Forestry
|
|
Fishing
|
|
Mining & Quarrying
|
|
Secondary Sector or Industrial sector
|
Manufacturing
|
|
Electricity, Gas and Water Supply
|
|
Construction
|
|
Tertiary Sector or Service Sector
|
Trade, Hotels and Restaurants
|
|
Transport
|
|
Storage
|
|
Communication
|
|
Financing, [Banking Insurance)
|
|
Real Estate and Business Services
|
|
Community, Social, Personal and other Services
|
Measures/Concepts of National Income
- Gross Domestic Product (GDP): GDP is the total money value of all final goods & services produced within the geographical boundaries of the country [produced l;y resident citizens + foreign nationals) during a given period of time, generally one year.
Q = Total quantity of final goods & services.
P = Price of final goods & services.
- Gross National Product (GNP): GNP is the money value of total output or production of final goods & services produced by the nationals of a country during a given period of time, generally a year. In this case, the income of all the resident & non-resident citizens of a country is included whereas the income of foreign nationals who reside within the geographical boundary of the country is excluded.
X = Export of goods & services
M = Import of goods & services
X - M = Net Factor Income from Abroad
(NFIA)
So,
- Net National Product (NNP): can be calculated in 2 ways;-
(i) NNP at market price:
Depreciation means wear & tear of goods produced.
NNP at market price includes Indirect taxes and excludes subsidies.
(ii) NNP at factor cost: NNP at factor cost calculates National Income only on the basis of cost incurred to produce the goods & services.
This cost is the payment made to the factors of production.
|
NNPfc = NNPmp Indirect Taxes + Subsidy
|
When NNP is obtained at factor cost, it is known as National Income.
Likewise, GDP at factor cost also can be calculated.
|
GDPfc = GDPmp Indirect Taxes + Subsidy
|
- Personal Income: It is that income which is actually obtained by nationals in one year.
P.I. = National Income – Undistributed Profits of Corporation – Payments for Social Security Provisions – Corporate Taxes + Government Transfer payments + Business Transfer payments + Net Interest paid by government.
SOCIAL SECURITY PROVISIONS = Payments made by employees towards pension &.provident fund
TRANSFER PAYMENTS = Payments made not against any productive activity, eg. - old age pension, unemployment compensation, disaster relief payment, etc.
- DISPOSAL PERSONAL INCOME (DPI): Income that is available to individuals that can be disposed at their will.
|
DPI = Personal Income Direct Taxes.
|
- National Income at constant price & current price
|
N1 CONSTANT PRICE = Total quantity of all final goods & services produced in a particular year x Price of base year.
|
Base year of National Income accounts is the year chosen to enable inter - year comparisons. The new series changes the base to 2011-12 from 2004-05
|
N1 CURRENT PRICE = Total quantity of all final goods & services produced in a particular year x Price of goods & services in th at particular year.
|
Estimates of National
Income
Pre-Independence: No central authority or government organization in India before independence to prepare National Income Estimates.
Independence; Estimates of National Income and Per Capita Income of India
|
Estimated By
|
Year of
Estimates
|
National Income
(Rs. Crore)
|
Per Capita Income (Rs.)
|
|
Dadabhai Naoroji
|
1867-68
|
340
|
20
|
|
Wadia and Joshi
|
1913-14
|
1,067
|
44
|
|
Shah and Khambata
|
1921-22
|
2,364
|
74
|
|
V.K.R.V. Rao
|
1931-32
|
1,689
|
62
|
|
Ministry of Commerce [Govt. of India)
|
1945-46
|
6,234
|
198
|
Post-independence: P. C. Mahalanobis was the Chairman of the National Income Committee constituted in 1949. According to its first report in 1951, National Income of India was Rs.8,710 Crore and Per Capita Income was Rs. 225 in 1948-49.
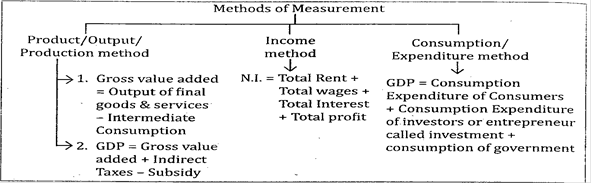
Methods of Calculating National Income -
Measurement of National Income
Difficulties in Measuring National Income in India
- Non-monetized Sector
- Lack of distinct differentiation in economic activities
- Conceptual problems
- Black money
- Inter-regional differences
- Non-availability of data about certain incomes
- Mass Illiteracy
- Difficulty in obtaining data about income
- Difficulties of sampling technique
Significance:
- Indicates economic growth
- Helps in policy formulation
- Inter- sectoral comparisons
- Helpful in trade union
- Distribution of income
- Helpful in economic planning
- Structural changes in the economy
- Facilitates forecasting
- Green accounting' means measuring the national income of a country taking into account estimation of pollution and environmental damage.
- The estimates of National Income in India are prepared by Central Statistical Organization (CSO) and are called National Accounts Statistics.
Indian Tax Structure
- Direct taxes are those which are imposed on a person either on his income or wealth and the tax liability cannot be escaped. It is governed by Central Board of Direct Taxes (CBDT).
- Indirect tax is collected by middle men in the channels of distribution of goods. It is governed by Central Board of Excise and Customs (CBEC).
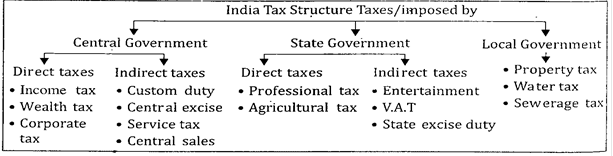
Different heads of income under tax structure in India;
- Salary
- House property
- Profit in business or profession
- Capital gains by sale of immovable assets
- Other sources
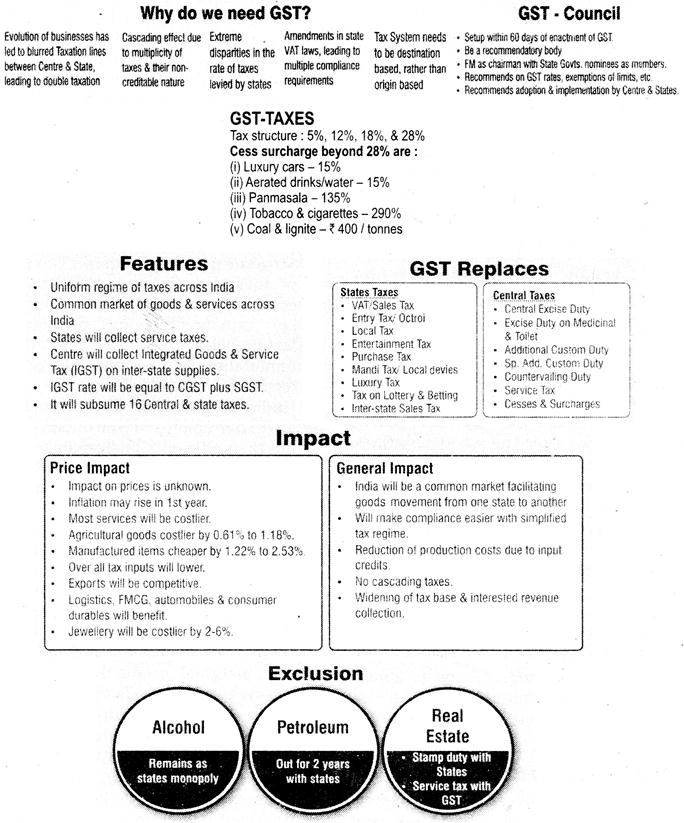
Goods & Service Tax (GST) 2017
Inclusive Development
- Inclusive growth refers to both the pace and pattern of the economic growth of a country.
- It focuses on economic growth which is a necessary and crucial condition for poverty reduction.
- It adopts a long term perspective and is concerned with sustainable growth.
- Inter-related elements of inclusive growth are:
- Poverty reduction and increase in quantity and quality of employment
- Agricultural development
- Social sector development
- Reduction in regional disparities
- Protecting the environment


