Answer:
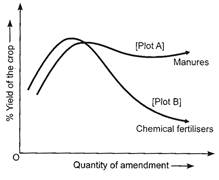
(i) With the addition of
chemical fertilisers there is sudden increase in yield due to release of
nutrients N, P, K, etc. in high quantity. The gradual decline in the graph may be
due to continuous use and high quantity of chemicals which kills microbes
useful for replenishing the organic matter in the soil. This decreases the soil
fertility.
(ii) Manures supply small quantities of
nutrients to the soil slowly as it contains large amounts of organic matter
[Hint: Importance of organic matter can be included]. It enriches soil with
nutrients; thereby increasing soil fertility continuously.
(iii) The differences in the two graphs
indicate that use of manure is beneficial for long duration in cropping as the
yield tends to remain high when the quantity of manure increases. In case of
plot B the chemical fertilisers may cause various problems when used
continuously for long time. Loss of microbial activity reduces decomposition of
organic matter and as a result, soil fertility is lost that affects the
yield.


You need to login to perform this action.
You will be redirected in
3 sec

