0
question_answer1) A graph in the shape of a circle to show relative sizes of data is called:
question_answer2) Directions: Given bar graph represents the number of students of different classes of a school who participated in a competition. Study the bar graph and answer the questions below: How many more students of class IV participated in the competition in comparison to class III?
question_answer3) Directions: Given bar graph represents the number of students of different classes of a school who participated in a competition. Study the bar graph and answer the questions below: How many students of class II and class V altogether participated in the competition?
question_answer4) Directions: Given bar graph represents the number of students of different classes of a school who participated in a competition. Study the bar graph and answer the questions below: How many students in total, of all five classes participated in the competition?
question_answer5) Directions: Given line graph represents the number of people in a store since its opening till closing at various times of a day. Study the line graph and answer the questions given below: How many people were there in the store when it opened?
question_answer6) Directions: Given line graph represents the number of people in a store since its opening till closing at various times of a day. Study the line graph and answer the questions given below: How many people were there in the store when it closed?
question_answer7) Directions: Given line graph represents the number of people in a store since its opening till closing at various times of a day. Study the line graph and answer the questions given below: What was the busiest time of the day at the store?
question_answer8) Directions: Given line graph represents the number of people in a store since its opening till closing at various times of a day. Study the line graph and answer the questions given below: How many people were there at the store between 1 pm to 2 pm?
question_answer9) Given pie chart represents the number of books on different subjects sold by a book seller. 
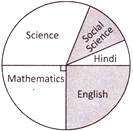
Of which two subjects, the books sold by the book seller were equal in number?
question_answer10) Given pictograph represent the different number of plants that were planted by the students of school in a particular week. Monday Tuesday Wednesday Thursday Friday Saturday One represents 15 plants What is the difference between maximum and minimum number of plants that were planted on two days in the week?
Please Wait you are being redirected....
You need to login to perform this action.You will be redirected in 3 sec
OTP has been sent to your mobile number and is valid for one hour
Your mobile number is verified.