-
question_answer1)
Mean of a set of observations is the value which
A)
occurs most frequently done
clear
B)
divides observation into two equal parts done
clear
C)
is a representative of the whole group done
clear
D)
is the sum of observations done
clear
View Solution play_arrow
-
question_answer2)
The mean of first ten natural numbers is
A)
\[\frac{5}{2}\] done
clear
B)
5 done
clear
C)
\[\frac{11}{2}\] done
clear
D)
\[\frac{13}{2}\] done
clear
View Solution play_arrow
-
question_answer3)
In a class test in English, 10 Students scored 75 marks 12 students scored 60 marks, 8 scored 40 marks. The mode for their scores is
A)
30 done
clear
B)
75 done
clear
C)
60 done
clear
D)
40 done
clear
View Solution play_arrow
-
question_answer4)
Frequency of a data means
A)
Number of observations done
clear
B)
Last observation done
clear
C)
Repeated observation done
clear
D)
Mode of data done
clear
View Solution play_arrow
-
question_answer5)
DIRECTIONS: Match Column-I with Column-II and select the correct answer using the codes given below the columns.
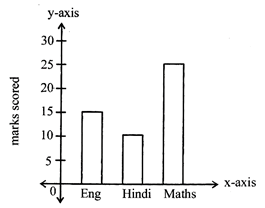
A)
\[A\to \,(iv);\,B\to (iii);\,C\to (ii);\,D\to (i)\] done
clear
B)
\[A\to \,(iv);\,B\to (iii);\,C\to (i);\,D\to (ii)\] done
clear
C)
\[A\to \,(iii);\,B\to (iv);\,C\to (ii);\,D\to (i)\] done
clear
D)
\[A\to \,(iii);\,B\to (iv);\,C\to (i);\,D\to (ii)\] done
clear
View Solution play_arrow
-
question_answer6)
DIRECTIONS: Match Column-I with Column-II and select the correct answer using the codes given below the columns.
A)
\[A\to \,(v);\,B\to (iii);\,C\to (i);\,D\to (iv);\,E\to (ii)\] done
clear
B)
\[A\to \,(ii);\,B\to (i);\,C\to (iv);\,D\to (iii);\,E\to (v)\] done
clear
C)
\[A\to \,(v);\,B\to (iii);\,C\to (iv);\,D\to (i);\,E\to (ii)\] done
clear
D)
\[A\to \,(ii);\,B\to (iii);\,C\to (iv);\,D\to (v);\,E\to (i)\] done
clear
View Solution play_arrow
-
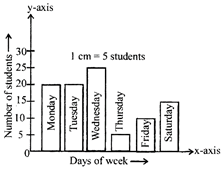
question_answer7)
Read the statements given below carefully and choose the correct bar graph to depict the statements correctly. (i) On Wednesday the attendance was maximum. (ii) On Saturday the attendance was minimum. (iii) On Monday and Thursday the attendance was same. (iv) On Wednesday the attendance was 150 students.
A)
B)
C)
View Solution play_arrow
-
question_answer8)
Read the following statements carefully and choose the correct answer. (i) The collection of a particular type of information in numerical figures is called data. (ii) The data obtained in its original form is called secondary data. (iii) Each numerical figure in the set of data is called an observation.
A)
(i) and (ii) are true while (iii) is false. done
clear
B)
(i) and (iii) are true while (ii) is false. done
clear
C)
(ii) and (iii) are true while (i) is false. done
clear
D)
None of the given (i), (ii) and (iii) is true. done
clear
View Solution play_arrow
-
question_answer9)
Given below a procedure to make a Bar Graph. Choose the correct order of steps by choosing the correct option. Step (A) Draw and label the scale on the vertical and horizontal axis. Step (B) Draw bars of equal widths from the zero of the horizontal scale and leave the same amount of space between bars. Step (C) Use the data from the table to choose an appropriate scale. Step (D) List the each item and locate the points on the graph.
A)
ABCD done
clear
B)
CBAD done
clear
C)
CADB done
clear
D)
CABD done
clear
View Solution play_arrow
-
question_answer10)
What is a Bar Graph?
A)
It is a graphical representation of the mathematical data by a figure of bars of even width. done
clear
B)
It is a graphical representation of the mathematical data by using pictures. done
clear
C)
It is a graph that uses points connected by lines to show how something changes in value. done
clear
D)
It is a graph in which the frequency is represented by the area of each rectangle. done
clear
View Solution play_arrow
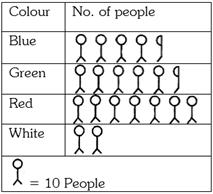
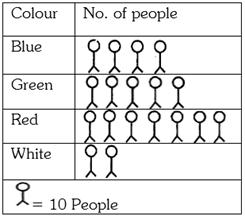
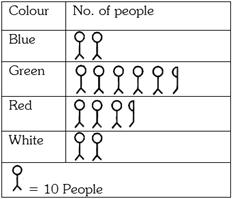
-
question_answer11)
Read the statements given below carefully. (i) 45 people prefer blue colour Fridge. (ii) Only 70 people like red colour Fridge. (iii) Ratio of the number of people preferring white colour to the number preferring blue colour is 4: 9. Which of the following Pictograph correctly describes the statements.
A)
B)
C)
D)
None of these done
clear
View Solution play_arrow
-
question_answer12)
What is the circulation of English newspaper?
A)
5000 done
clear
B)
2000 done
clear
C)
1000 done
clear
D)
4000 done
clear
View Solution play_arrow
-
question_answer13)
By how much is the circulation of newspaper in Hindi more than the newspaper in Bengali.
A)
700 done
clear
B)
900 done
clear
C)
1000 done
clear
D)
800 done
clear
View Solution play_arrow
-
question_answer14)
Name the two language in which circulation of newspaper is the same in Bengali
A)
Bengali and English done
clear
B)
Marathi and Bengali done
clear
C)
Hindi and English done
clear
D)
Urdu and English done
clear
View Solution play_arrow
-
question_answer15)
The highest peak is _______.
A)
A done
clear
B)
E done
clear
C)
C done
clear
D)
B done
clear
View Solution play_arrow
-
question_answer16)
The ratio of the heights of highest peak and the lowest peak is ______.
A)
22 : 15 done
clear
B)
15 : 22 done
clear
C)
20 : 13 done
clear
D)
13 : 22 done
clear
View Solution play_arrow
-
question_answer17)
Second highest peak is _______.
A)
B done
clear
B)
A done
clear
C)
C done
clear
D)
E done
clear
View Solution play_arrow
-
question_answer18)
When the heights of the given peaks are written in ascending order, then the average of the middle two peaks is -
A)
7950m done
clear
B)
7560m done
clear
C)
7650m done
clear
D)
7850m done
clear
View Solution play_arrow
-
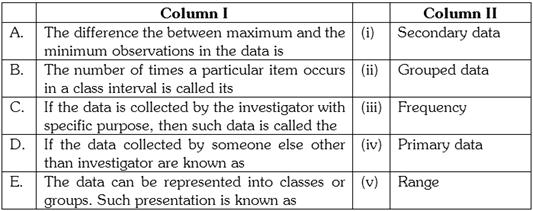
question_answer19)
The Bar graph shows the sale of math books in a bookshop for the first six months.
In which month was the sale of maths books 75% of the sale of books in June?
A)
March done
clear
B)
April done
clear
C)
May done
clear
D)
February done
clear
View Solution play_arrow
-
question_answer20)
Read the given below pictograph carefully.
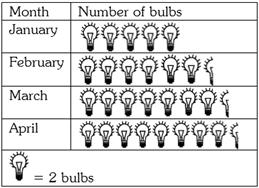
Which of the following statement is false for the pictograph?
A)
In February purchase of bulbs was 13. done
clear
B)
17 bulbs purchased in the month of April. done
clear
C)
Total number of bulbs purchased during January and March is 25. done
clear
D)
None of these done
clear
View Solution play_arrow
-
question_answer21)
Read the bar graph given below carefully. What is the information given by the bar graph?
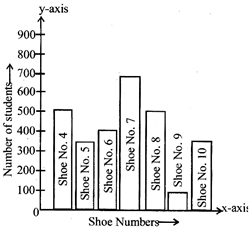
A)
The bar graph represents the number of students wearing shoes of different numbers out of a total of 700 students. done
clear
B)
It shows that the shoe number 7 is worn by the minimum number of students. done
clear
C)
It represents the shoe number 9 is worn by the maximum number of students. done
clear
D)
The bar graph represents the number of students wearing shoes of different numbers out of a total of 2900 selected students. done
clear
View Solution play_arrow
-
question_answer22)
DIRECTIONS: Match Column-I with Column-II and select the correct answer using the codes given below the columns. The following bar graph shows the number of houses (out of 100) in a town using different types of fuels for cooking. Scale: 1 unit length = 5 houses
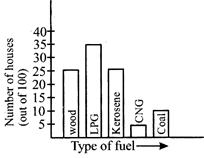
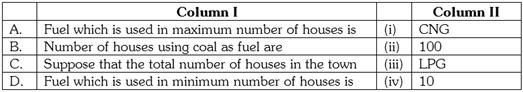
A)
\[A\to (i);\,B\to (ii);\,C\to \,(iv);\,d\to \,(iii)\] done
clear
B)
\[A\to (iii);\,B\to (ii);\,C\to \,(iv);\,d\to \,(i)\] done
clear
C)
\[A\to (iii);\,B\to (iv);\,C\to \,(ii);\,d\to \,(i)\] done
clear
D)
\[A\to (i);\,B\to (iv);\,C\to \,(ii);\,d\to \,(iii)\] done
clear
View Solution play_arrow
-
question_answer23)
On how many days were there fewer than 160 visitors?
A)
33 done
clear
B)
36 done
clear
C)
30 done
clear
D)
37 done
clear
View Solution play_arrow
-
question_answer24)
For how many days did the survey last?
A)
75 done
clear
B)
55 done
clear
C)
100 done
clear
D)
50 done
clear
View Solution play_arrow
-
question_answer25)
Calculate the percentage of days on which at least 190 people visited the library?
A)
25% done
clear
B)
8% done
clear
C)
4% done
clear
D)
10% done
clear
View Solution play_arrow
-
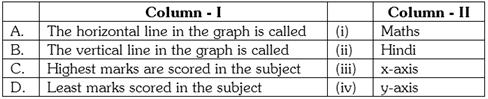
question_answer26)
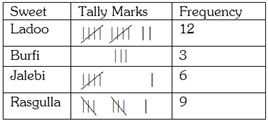
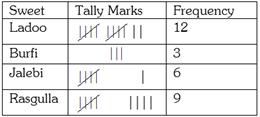
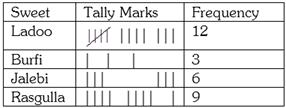
DIRECTIONS: Passage-2 Read the passage(s) given below and answer the questions that follow. Following is the choice of sweet of 30 students of class VI: Ladoo, Barfi, Ladoo, Jalebi, Ladoo, Rasgulla, Jalebi, Ladoo, Barfi, Rasgula, Ladoo, Jalebi, Jalebi, Rasgulla, Ladoo, Rasgulla, Jalebi, Ladoo, Rasgulla, Ladoo, Rasgulla, Jalebi, Ladoo, Rasgulla, Ladoo, Ladoo, Barfi, Rasgulla, Rasgulla, Ladoo, Which of the following table in tally marks is correct for the given data?
A)
B)
C)
D)
View Solution play_arrow
-
question_answer27)
Read the statements given below carefully and choose the best answer. (i) The change in the weight of a child from when it was born to say when it attains an age of 12 years can be illustrated by a line graph. (ii) Points on a line graph are connected by line segments. (iii) On a line graph, a rise from left to right indicates increase
A)
(i) and (ii) are true while (iii) are false. done
clear
B)
(i) and (iii) are true while (ii) are false. done
clear
C)
Neither (i) and (ii) nor (iii) is true. done
clear
D)
(i), (ii) and (iii) are true. done
clear
View Solution play_arrow
-
question_answer28)
The runner-up in the milk yield per cattle per year is
A)
India done
clear
B)
USA done
clear
C)
Japan done
clear
D)
NZ done
clear
View Solution play_arrow
-
question_answer29)
Which of the following statements is correct?
A)
Per cattle yield of milk in India is same as that of N.Z. done
clear
B)
USA produced one tonne more milk per cattle than Japan. done
clear
C)
Per cattle yearly yield of milk in Australia and EEC equals that of Israel. done
clear
D)
Yearly per cattle yield of milk in Israel is three times that of N.Z. done
clear
View Solution play_arrow
-
question_answer30)
If the milk yield per year is increased by ten times in India, then it will.
A)
exceed that of Israel. done
clear
B)
be equal that of Australia. done
clear
C)
be equal that of Canada. done
clear
D)
be 7 times more than that of NZ done
clear
View Solution play_arrow
-
question_answer31)
Following is the pictograph of the number of wrist watches manufactured by a factory in a particular week.
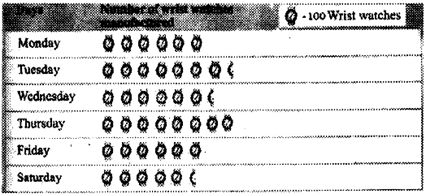
Complete the following table based on pictograph by choosing correct option.
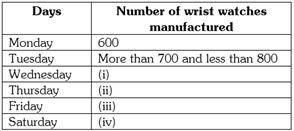
A)
(i) ® 650 (ii) ® On this day maximum number of watches manufactured (iii) ® 600 (iv) ® More than 500 and less than 600. done
clear
B)
(i) ® Maximum number of watches manufactured on this day. (ii) ® 650 (iii) ® 600 (iv) ® More than 600 done
clear
C)
(i) ® Minimum number of watches manufactured on this day. (ii) ® 650 (iii) ® 600 (iv) ® 800 done
clear
D)
(i) 600 (ii) 500 (iii) 650 (iv) 550 done
clear
View Solution play_arrow
 done
clear
done
clear
 done
clear
done
clear
 done
clear
done
clear
 done
clear
done
clear
 done
clear
done
clear
 done
clear
done
clear
 done
clear
done
clear
 done
clear
done
clear
 done
clear
done
clear
 done
clear
done
clear


