-
question_answer1)
Directions: The following table gives the sales of inverters by a company in a particular state. Study the following table and answer the following questions:
|
Year
|
Types of inverters
|
|
|
600VA
|
900VA
|
1500VA
|
3KVA
|
Total
|
|
2005
|
75
|
144
|
49
|
132
|
400
|
|
2006
|
90
|
180
|
102
|
128
|
500
|
|
2007
|
120
|
150
|
109
|
121
|
500
|
|
2008
|
145
|
72
|
126
|
107
|
450
|
|
2009
|
80
|
60
|
147
|
73
|
360
|
|
2010
|
70
|
80
|
189
|
85
|
424
|
|
Total sales of all the six years is maximum for which inverter?
A)
600 VA done
clear
B)
900 VA done
clear
C)
1500 VA done
clear
D)
3 KVA done
clear
E)
None of these done
clear
View Solution play_arrow
-
question_answer2)
|
Directions: The following table gives the sales of inverters by a company in a particular state. Study the following table and answer the following questions:
|
|
Year
|
Types of inverters
|
|
|
600VA
|
900VA
|
1500VA
|
3KVA
|
Total
|
|
2005
|
75
|
144
|
49
|
132
|
400
|
|
2006
|
90
|
180
|
102
|
128
|
500
|
|
2007
|
120
|
150
|
109
|
121
|
500
|
|
2008
|
145
|
72
|
126
|
107
|
450
|
|
2009
|
80
|
60
|
147
|
73
|
360
|
|
2010
|
70
|
80
|
189
|
85
|
424
|
|
What is the difference in the number of 1500 VA inverters sold in 2008 and 2010?
A)
42 done
clear
B)
63 done
clear
C)
73 done
clear
D)
84 done
clear
E)
None of these done
clear
View Solution play_arrow
-
question_answer3)
|
Directions: The following table gives the sales of inverters by a company in a particular state. Study the following table and answer the following questions:
|
|
Year
|
Types of inverters
|
|
|
600VA
|
900VA
|
1500VA
|
3KVA
|
Total
|
|
2005
|
75
|
144
|
49
|
132
|
400
|
|
2006
|
90
|
180
|
102
|
128
|
500
|
|
2007
|
120
|
150
|
109
|
121
|
500
|
|
2008
|
145
|
72
|
126
|
107
|
450
|
|
2009
|
80
|
60
|
147
|
73
|
360
|
|
2010
|
70
|
80
|
189
|
85
|
424
|
|
Total number of inverters sold in year 2009 is what percent of the total sales in year 2008?
A)
20 % done
clear
B)
40 % done
clear
C)
60 % done
clear
D)
80 % done
clear
E)
None of these done
clear
View Solution play_arrow
-
question_answer4)
|
Directions: The following table gives the sales of inverters by a company in a particular state. Study the following table and answer the following questions:
|
|
Year
|
Types of inverters
|
|
|
600VA
|
900VA
|
1500VA
|
3KVA
|
Total
|
|
2005
|
75
|
144
|
49
|
132
|
400
|
|
2006
|
90
|
180
|
102
|
128
|
500
|
|
2007
|
120
|
150
|
109
|
121
|
500
|
|
2008
|
145
|
72
|
126
|
107
|
450
|
|
2009
|
80
|
60
|
147
|
73
|
360
|
|
2010
|
70
|
80
|
189
|
85
|
424
|
|
Average number of inverters sold per year is:
A)
424 done
clear
B)
439 done
clear
C)
450 done
clear
D)
480 done
clear
E)
None of these done
clear
View Solution play_arrow
-
question_answer5)
|
Directions: The following table gives the sales of inverters by a company in a particular state. Study the following table and answer the following questions:
|
|
Year
|
Types of inverters
|
|
|
600VA
|
900VA
|
1500VA
|
3KVA
|
Total
|
|
2005
|
75
|
144
|
49
|
132
|
400
|
|
2006
|
90
|
180
|
102
|
128
|
500
|
|
2007
|
120
|
150
|
109
|
121
|
500
|
|
2008
|
145
|
72
|
126
|
107
|
450
|
|
2009
|
80
|
60
|
147
|
73
|
360
|
|
2010
|
70
|
80
|
189
|
85
|
424
|
|
The percentage increase in total number of inverters sold in 2006 to that in year 2005 is:
A)
25 % done
clear
B)
20 % done
clear
C)
30 % done
clear
D)
35 % done
clear
E)
None of these done
clear
View Solution play_arrow
-
question_answer6)
A train runs x km at an average speed of \[{{k}_{1}}\]km/h and y km at an average speed of \[{{k}_{2}}\]km/h. The average speed of the train for the entire journey is:
A)
\[\frac{x+y}{{{k}_{^{1}}}+{{k}_{^{2}}}}km\text{/}h\] done
clear
B)
\[\frac{{{k}_{^{1}}}{{k}_{^{2}}}(x+y)}{x{{k}_{2}}+y{{k}_{1}}}km\text{/}h\] done
clear
C)
\[\frac{x{{k}_{^{1}}}+y{{k}_{^{2}}}}{{{k}_{2}}+{{k}_{1}}}km\text{/}h\] done
clear
D)
\[\frac{xy({{k}_{1}}+{{k}_{^{2}}})}{x{{k}_{1}}+y{{k}_{2}}}km\text{/}h\] done
clear
E)
None of these done
clear
View Solution play_arrow
-
question_answer7)
Amit choose three numbers x, y and z in such a way that the x is twice of y and thrice of z, if the average of all the three numbers is 88, then the smallest number is:
A)
46 done
clear
B)
48 done
clear
C)
52 done
clear
D)
72 done
clear
E)
None of these done
clear
View Solution play_arrow
-
question_answer8)
The mean of 30 observations is 40. If 16 is from then the new mean will be:
A)
24 done
clear
B)
28 done
clear
C)
32 done
clear
D)
36 done
clear
E)
None of these done
clear
View Solution play_arrow
-
question_answer9)
| Directions for: The following pie graph shows the number of certain players of a particular country playing different games. Study the pie graph carefully and answer the following questions: |
 |
What percent of sportsperson play only Tennis?
A)
33 % done
clear
B)
25 % done
clear
C)
12.5 % done
clear
D)
50 % done
clear
E)
None of these done
clear
View Solution play_arrow
-
question_answer10)
| Directions for: The following pie graph shows the number of certain players of a particular country playing different games. Study the pie graph carefully and answer the following questions: |
 |
By how much percent Tennis is played more than Baseball?
A)
10.42 % done
clear
B)
31.33 % done
clear
C)
200 % done
clear
D)
416.7 % done
clear
E)
None of these done
clear
View Solution play_arrow
-
question_answer11)
| Directions for: The following pie graph shows the number of certain players of a particular country playing different games. Study the pie graph carefully and answer the following questions: |
 |
If the total number of players is 90000, then the number of persons playing only Golf is:
A)
10000 done
clear
B)
15000 done
clear
C)
7500 done
clear
D)
5000 done
clear
E)
None of these done
clear
View Solution play_arrow
-
question_answer12)
| Directions for: The following pie graph shows the number of certain players of a particular country playing different games. Study the pie graph carefully and answer the following questions: |
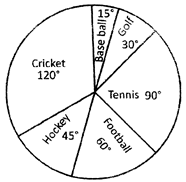 |
Which sports is played most?
A)
Cricket done
clear
B)
Football done
clear
C)
Tennis done
clear
D)
Hockey done
clear
E)
None of these done
clear
View Solution play_arrow
-
question_answer13)
| Directions for: The following pie graph shows the number of certain players of a particular country playing different games. Study the pie graph carefully and answer the following questions: |
 |
The ratio between the number of person playing Golf to that of the persons playing Hockey is:
A)
1 : 2 done
clear
B)
1 : 3 done
clear
C)
3 : 4 done
clear
D)
2 : 3 done
clear
E)
None of these done
clear
View Solution play_arrow
-
question_answer14)
| Directions for: The following pie graph shows the number of certain players of a particular country playing different games. Study the pie graph carefully and answer the following questions: |
 |
If the total number of persons is 90000, then the difference between the number of persons playing only Tennis and Hockey is:
A)
11250 done
clear
B)
8250 done
clear
C)
7500 done
clear
D)
6750 done
clear
E)
None of these done
clear
View Solution play_arrow
-
question_answer15)
| Directions for: The following line graph gives the annual profit percent earned by a company during 2005 - 2010. |
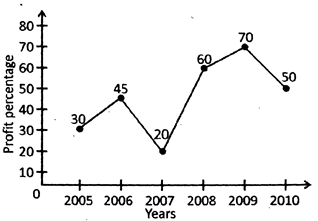 |
If the expenditures in 2006 and 2009 are equal, then the ratio of income in 2006 to that in 2009 is:
A)
17 : 18 done
clear
B)
29 : 34 done
clear
C)
23 : 34 done
clear
D)
9 : 14 done
clear
E)
None of these done
clear
View Solution play_arrow
-
question_answer16)
| Directions for: The following line graph gives the annual profit percent earned by a company during 2005 - 2010. |
| |
The average profit earned during 2005 - 2010 is:
A)
23.5 % done
clear
B)
48.3 % done
clear
C)
45.8 % done
clear
D)
50.2 % done
clear
E)
None of these done
clear
View Solution play_arrow
-
question_answer17)
| Directions for: The following line graph gives the annual profit percent earned by a company during 2005 - 2010. |
| |
The maximum profit is earned in which year?
A)
2006 done
clear
B)
2007 done
clear
C)
2009 done
clear
D)
2010 done
clear
E)
None of these done
clear
View Solution play_arrow
-
question_answer18)
| Directions for: The following line graph gives the annual profit percent earned by a company during 2005 - 2010. |
 |
The expenditure is minimum in which year?
A)
2006 done
clear
B)
2007 done
clear
C)
2009 done
clear
D)
Cannot be determined done
clear
E)
None of these done
clear
View Solution play_arrow
-
question_answer19)
| Directions for: The following line graph gives the annual profit percent earned by a company during 2005 - 2010. |
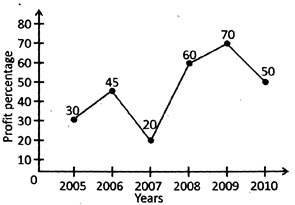 |
During which year the ratio of percentage of profit earned to that in the previous year is minimum?
A)
2006 done
clear
B)
2007 done
clear
C)
2008 done
clear
D)
2009 done
clear
E)
None of these done
clear
View Solution play_arrow
-
question_answer20)
| Directions for: The following line graph gives the annual profit percent earned by a company during 2005 - 2010. |
 |
During which year the ratio of percentage of profit earned to that in the previous year is maximum?
A)
2006 done
clear
B)
2007 done
clear
C)
2008 done
clear
D)
2009 done
clear
E)
None of these done
clear
View Solution play_arrow
-
question_answer21)
| Directions for: The following bar graph shows the number of students studying various subjects in a college- Study the bar graph carefully and answer the following questions. |
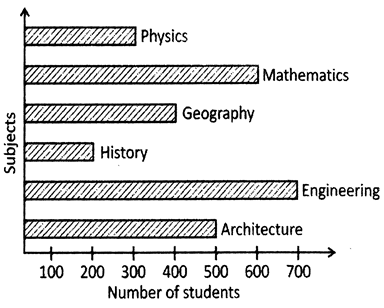 |
Which subject is studied most?
A)
Physics done
clear
B)
Mathematics done
clear
C)
Engineering done
clear
D)
History done
clear
E)
None of these done
clear
View Solution play_arrow
-
question_answer22)
| Directions for: The following bar graph shows the number of students studying various subjects in a college- Study the bar graph carefully and answer the following questions. |
 |
The ratio of the number of students studying History to that of the students studying only Architecture is:
A)
1 : 2 done
clear
B)
3 : 4 done
clear
C)
2 : 7 done
clear
D)
2 : 5 done
clear
E)
None of these done
clear
View Solution play_arrow
-
question_answer23)
| Directions for: The following bar graph shows the number of students studying various subjects in a college- Study the bar graph carefully and answer the following questions. |
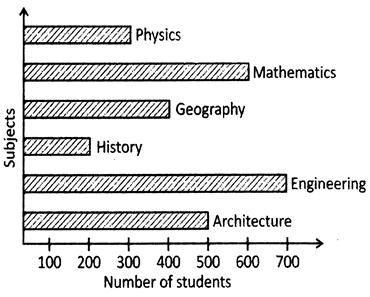 |
The number of students studying only History is what percent of the total number of students?
A)
6.67 % done
clear
B)
11.11 % done
clear
C)
13.67 % done
clear
D)
22.22 % done
clear
E)
None of these done
clear
View Solution play_arrow
-
question_answer24)
| Directions for: The following bar graph shows the number of students studying various subjects in a college- Study the bar graph carefully and answer the following questions. |
 |
The number of students studying Mathematics only is what percent of the number of students studying Geography and Architecture altogether?
A)
\[66\frac{2}{3}%\] done
clear
B)
\[33\frac{1}{3}%\] done
clear
C)
\[23\frac{1}{3}%\] done
clear
D)
\[46\frac{2}{3}%\] done
clear
E)
None of these done
clear
View Solution play_arrow
-
question_answer25)
| Directions for: The following bar graph shows the number of students studying various subjects in a college- Study the bar graph carefully and answer the following questions. |
 |
The average number of students studying each subject is:
A)
750 done
clear
B)
600 done
clear
C)
900 done
clear
D)
450 done
clear
E)
None of these done
clear
View Solution play_arrow
-
question_answer26)
The point \[(-\,3,-2)\] lies in which quadrant?
A)
\[{{I}^{st}}\] done
clear
B)
\[I{{I}^{nd}}\] done
clear
C)
\[II{{I}^{rd}}\] done
clear
D)
\[~I{{V}^{th}}\] done
clear
E)
None of these done
clear
View Solution play_arrow
-
question_answer27)
Which of the following options is incorrect?
A)
A bar graph is used to show comparison among different categories done
clear
B)
A pie graph is used to compare parts of a whole done
clear
C)
A linear graph which is a whole unbroken line is called a line graph done
clear
D)
All of these done
clear
E)
None of these done
clear
View Solution play_arrow
-
question_answer28)
The chart used to depict the division of a total into sub-portions is known as:
A)
Bar graph done
clear
B)
Line graph done
clear
C)
Linear graph done
clear
D)
Pie graph done
clear
E)
None of these done
clear
View Solution play_arrow
-
question_answer29)
A batsman makes a score of 85 in his 17th innings and therefore his average increased by 4. His average after 17 inning is:
A)
17 done
clear
B)
19 done
clear
C)
18 done
clear
D)
21 done
clear
E)
None of these done
clear
View Solution play_arrow
-
question_answer30)
The mean weight of 12 person?s increased by 2.5 kg when a new person comes in place of hem by replacing a person whose weight is 68 kg. the weight of the new person is:
A)
78 kg done
clear
B)
88 kg done
clear
C)
98 kg done
clear
D)
75 kg done
clear
E)
None of these done
clear
View Solution play_arrow
-
question_answer31)
| Construct a frequency distribution table for the following data and find which number has highest frequency? |
| 5, 1, 3, 4, 2, 1, 3, 5, 4, 2, 1, 5, 1, 3, 2, 1, 5, 3, 3, 2. |
A)
2 done
clear
B)
1 and 3 done
clear
C)
4 done
clear
D)
6 done
clear
E)
None of these done
clear
View Solution play_arrow
-
question_answer32)
| The following are the marks obtained by 50 students in Mathematics in their previous examination held in their school. Find the range of the given below: |
| 45 68 41 87 61 44 67 30 54 8 39 60 37 50 19 86 42 29 32 61 25 |
| 77 62 98 47 36 15 40 9 25 34 50 61 75 51 96 20 13 18 35 43 88 |
| 25 95 68 81 29 41 45 87 |
A)
90 done
clear
B)
75 done
clear
C)
80 done
clear
D)
60 done
clear
E)
None of these done
clear
View Solution play_arrow
-
question_answer33)
The data given below represents the activity of the students after school. Which one is the most favourite activity of the students after school?
| Favourite Activity of Student after school |
| Activity | Visiting friends | Talking friends | Playing friends | Earning friends | Using computer |
| Number of Student | 175 | 168 | 120 | 120 | 65 |
A)
Visiting friends done
clear
B)
Talking on phone done
clear
C)
Earning money done
clear
D)
Using computers done
clear
E)
None of these done
clear
View Solution play_arrow
-
question_answer34)
| Find the cumulative frequency of the number 5 from the data given below. |
| 1, 1, 2, 2, 2, 2, 2, 3, 3, 3, 3, 4, 4, 4, 4, 4, 4, 4, 5, 5, 5, 6, 6, 6, 6, 6, 7, 7, 7, 7, 7, 7, 7, 7, 7 |
A)
35 done
clear
B)
21 done
clear
C)
18 done
clear
D)
26 done
clear
E)
None of these done
clear
View Solution play_arrow
-
question_answer35)
| Directions for: The following pie chart shows the distribution of the expenditure incurred for publishing a book. |
 |
The percentage of the central angle corresponding to the expenditure incurred on paper cost is:
A)
10 % done
clear
B)
15 % done
clear
C)
20 % done
clear
D)
30 % done
clear
E)
None of these done
clear
View Solution play_arrow
-
question_answer36)
| Directions for: The following pie chart shows the distribution of the expenditure incurred for publishing a book. |
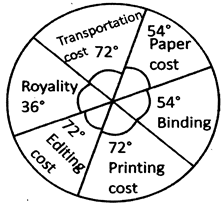 |
Royalty on the book is less than the editing cost by:
A)
10 % done
clear
B)
15 % done
clear
C)
20 % done
clear
D)
25 % done
clear
E)
None of these done
clear
View Solution play_arrow
-
question_answer37)
| Directions for: The following pie chart shows the distribution of the expenditure incurred for publishing a book. |
 |
If the transportation cost is Rs 1,80,000 then the binding cost is:
A)
Rs 90, 000 done
clear
B)
Rs 1, 12, 000 done
clear
C)
Rs 1, 35, 000 done
clear
D)
Rs 1, 80, 000 done
clear
E)
None of these done
clear
View Solution play_arrow
-
question_answer38)
| Directions for: The graph given below shows the number of runs scored during a cricket match by a team 10 overs. Study the graph and answer the following question: |
 |
In which over the minimum runs was scored?
A)
\[{{3}^{rd}}\] done
clear
B)
\[{{6}^{th}}\] done
clear
C)
\[{{8}^{th}}\] done
clear
D)
\[{{9}^{th}}\] done
clear
E)
None of these done
clear
View Solution play_arrow
-
question_answer39)
| Directions for: The graph given below shows the number of runs scored during a cricket match by a team 10 overs. Study the graph and answer the following question: |
 |
The difference between the minimum and maximum runs scored in first ten overs is:
A)
24 done
clear
B)
5 done
clear
C)
19 done
clear
D)
18 done
clear
E)
None of these done
clear
View Solution play_arrow
-
question_answer40)
| Directions for: The graph given below shows the number of runs scored during a cricket match by a team 10 overs. Study the graph and answer the following question: |
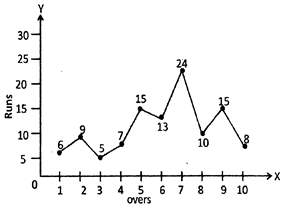 |
The average of the runs scored during first 10 overs is:
A)
10.6 done
clear
B)
11.2 done
clear
C)
10.8 done
clear
D)
12.4 done
clear
E)
None of these done
clear
View Solution play_arrow


