-
question_answer1)
A bag contains 20 cards numbered 1, 2, 3, .., 20. One of them is drawn from the bag. Find the probability that it has a prime number on it.
A)
\[\frac{2}{3}\] done
clear
B)
\[\frac{1}{2}\] done
clear
C)
\[\frac{2}{5}\] done
clear
D)
\[\frac{1}{6}\] done
clear
View Solution play_arrow
-
question_answer2)
From a well shuffled pack of cards, a card is drawn at random. Find the probability of getting a black queen.
A)
\[\frac{1}{13}\] done
clear
B)
\[\frac{1}{26}\] done
clear
C)
\[\frac{1}{14}\] done
clear
D)
\[\frac{3}{52}\] done
clear
View Solution play_arrow
-
question_answer3)
If a person saved Rs. 100 from his total income of Rs. 2000, what is the central angle of the sector in a pie-diagram showing his savings?
A)
\[20{}^\circ \] done
clear
B)
\[18{}^\circ \] done
clear
C)
\[36{}^\circ \] done
clear
D)
\[{{\left( \frac{1}{20} \right)}^{o}}\] done
clear
View Solution play_arrow
-
question_answer4)
Match the following.
| | Column I | | Column II |
| A | The graph in which the same type of pictures or symbols are used to represent equal number of facts. | (i) | Pie diagram |
| B | The graph with a fixed gap between two bars. | (ii) | Used to represent relative sizes of components in a total. |
| C | Sum of the central angles is 360° in this diagram. | (iii) | Pictograph |
| D | Circle graph | (iv) | Bar diagram |
| E | Pictograph | (v) | All symbols must be of uniform size. But part of a symbol can also be used. |
A)
(A)-(iii), (B)-(iv), (C)-(i), (D)-(ii), (E)-(v) done
clear
B)
(A)-(i), (B)-(ii), (C)-(iii), (D)-(iv), (E)-(v) done
clear
C)
(A)-(ii), (B)-(iv), (C)-(v), (D)-(i), (E)-(iii) done
clear
D)
(A)-(iii), (B)-(i), (C)-(v), (D)-(iv), (E)-(ii) done
clear
View Solution play_arrow
-
question_answer5)
Which of the following gives the central angle for a component?
A)
\[\frac{\text{Value}\,\text{of}\,\text{the}\,\text{component}}{\text{Total}\,\text{value}}\times {{180}^{o}}\] done
clear
B)
\[\frac{\text{Total}\,\text{value}}{\text{Value}\,\text{of}\,\text{the}\,\text{component}}\times {{360}^{o}}\] done
clear
C)
\[\frac{\text{Value}\,\text{of}\,\text{the}\,\text{component}}{\text{Total}\,\text{value}}\times {{90}^{o}}\] done
clear
D)
\[\frac{\text{Value}\,\text{of}\,\text{the}\,\text{component}}{\text{Total}\,\text{value}}\times {{360}^{o}}\] done
clear
View Solution play_arrow
-
question_answer6)
A fair die is thrown. Find the probability of getting a number less than 3.
A)
\[\frac{1}{3}\] done
clear
B)
\[\frac{1}{2}\] done
clear
C)
\[\frac{1}{6}\] done
clear
D)
\[\frac{1}{4}\] done
clear
View Solution play_arrow
-
question_answer7)
What is the sum of the angles of various sectors in a pie - diagram?
A)
\[90{}^\circ \] done
clear
B)
\[180{}^\circ \] done
clear
C)
\[270{}^\circ \] done
clear
D)
\[360{}^\circ \] done
clear
View Solution play_arrow
-
question_answer8)
A bar graph is drawn to the scale 1 cm = 10 units. If the length of the bar representing a quantity is 4.3 cm, find the value of the quantity represented by the bar.
A)
4.3 units done
clear
B)
430 units done
clear
C)
43 units done
clear
D)
0.43 units done
clear
View Solution play_arrow
-
question_answer9)
A bar graph is drawn to the scale 1 cm = 5 units. Find the length of the bar representing a quantity of 52 units.
A)
5.2 cm done
clear
B)
10.4 cm done
clear
C)
2.6 cm done
clear
D)
0.52 cm done
clear
View Solution play_arrow
-
question_answer10)
The percentage of marks obtained by a student in four subjects are English- 40, Mathematics - 70, Science - 50 and Social studies 20. A pie diagram is drawn showing the data. Find the angle of the sector representing Mathematics in the pie diagram.
A)
\[140{}^\circ \] done
clear
B)
\[70{}^\circ \] done
clear
C)
\[100{}^\circ \] done
clear
D)
\[40{}^\circ \] done
clear
View Solution play_arrow
-
question_answer11)
In a bar diagram the value represented by a rectangle is proportional to its ___.
A)
length done
clear
B)
breadth done
clear
C)
area done
clear
D)
perimeter done
clear
View Solution play_arrow
-
question_answer12)
A bag contains 4 red and 6 black balls. A ball is taken out of the bag at random. Find the probability of getting a black ball.
A)
\[\frac{1}{5}\] done
clear
B)
\[\frac{2}{5}\] done
clear
C)
\[\frac{3}{5}\] done
clear
D)
\[\frac{4}{5}\] done
clear
View Solution play_arrow
-
question_answer13)
Direction: The adjoining pie chart gives the expenditure of a family on various items during a month. 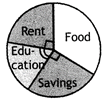 |
On which item is the expenditure the maximum?
A)
Education done
clear
B)
Food done
clear
C)
Savings done
clear
D)
Rent done
clear
View Solution play_arrow
-
question_answer14)
Direction: The adjoining pie chart gives the expenditure of a family on various items during a month. 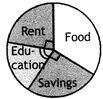 |
If the monthly income of the family is Rs. 9000, what is the expenditure on rent?
A)
Rs. 4500 done
clear
B)
Rs. 3000 done
clear
C)
Rs. 2250 done
clear
D)
Rs. 1700 done
clear
View Solution play_arrow
-
question_answer15)
| Direction: The adjoining pie chart gives the expenditure of a family on various items during a month. |
If the expenditure on food is Rs. 3000, what is the expenditure on education of children?
A)
Rs. 2000 done
clear
B)
Rs. 1500 done
clear
C)
Rs. 3000 done
clear
D)
Rs. 2500 done
clear
View Solution play_arrow
-
question_answer16)
A die is thrown once. Find the probability of getting a number divisible by 2.
A)
\[\frac{1}{3}\] done
clear
B)
\[\frac{1}{4}\] done
clear
C)
\[\frac{1}{2}\] done
clear
D)
\[\frac{1}{5}\] done
clear
View Solution play_arrow
-
question_answer17)
In a pictogram 100 units are represented by 2 figures. Find the number of figures required to represent 250 units.
A)
3 done
clear
B)
5 done
clear
C)
8 done
clear
D)
9 done
clear
View Solution play_arrow
-
question_answer18)
Direction: The pie chart shows the number of cars, lorries, vans and autos assembled at a factory in one month. The factory assembled 60 autos during the month. 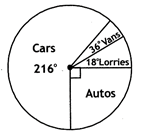 |
How many vehicles altogether were assembled during the month?
A)
280 done
clear
B)
300 done
clear
C)
240 done
clear
D)
220 done
clear
View Solution play_arrow
-
question_answer19)
| Direction: The pie chart shows the number of cars, lorries, vans and autos assembled at a factory in one month. The factory assembled 60 autos during the month. |
What fraction of the number of vehicles assembled were lorries?
A)
\[\frac{1}{18}\] done
clear
B)
\[\frac{1}{16}\] done
clear
C)
\[\frac{1}{14}\] done
clear
D)
\[\frac{1}{20}\] done
clear
View Solution play_arrow
-
question_answer20)
| Direction: The pie chart shows the number of cars, lorries, vans and autos assembled at a factory in one month. The factory assembled 60 autos during the month. |
How many cars were assembled?
A)
130 done
clear
B)
144 done
clear
C)
112 done
clear
D)
110 done
clear
View Solution play_arrow
-
question_answer21)
A coin is tossed 300 times with the following frequencies of the two outcomes: Head: 180 times, tail: 120 times. Find the probability of occurence of each of these events.
A)
\[\frac{1}{2},\frac{1}{3}\] done
clear
B)
\[\frac{4}{5},\frac{6}{7}\] done
clear
C)
\[\frac{3}{5},\frac{2}{5}\] done
clear
D)
\[\frac{1}{5},\frac{1}{6}\] done
clear
View Solution play_arrow
-
question_answer22)
Direction: Observe the bar chart and answer the questions given.  |
What is the total number of vehicles of all types produced in 2011?
A)
1200000 done
clear
B)
1072000 done
clear
C)
1125350 done
clear
D)
1424450 done
clear
View Solution play_arrow
-
question_answer23)
| Direction: Observe the bar chart and answer the questions given. |
Which vehicles are produced more than any other?
A)
Mopeds done
clear
B)
Jeeps done
clear
C)
Cars done
clear
D)
Scotters done
clear
View Solution play_arrow
-
question_answer24)
| Direction: Observe the bar chart and answer the questions given. |
Which type of two wheelers are the least produced?
A)
Mopeds done
clear
B)
Motor cycles done
clear
C)
Scooters done
clear
D)
Jeeps done
clear
View Solution play_arrow
-
question_answer25)
Direction: Observe the bar chart and answer the questions given. 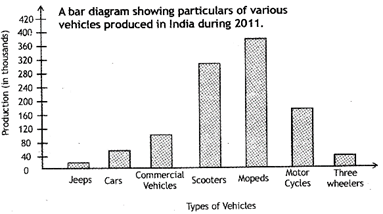 |
What is the approximate number of all the four wheelers produced?
A)
184000 done
clear
B)
148500 done
clear
C)
128550 done
clear
D)
165720 done
clear
View Solution play_arrow
-
question_answer26)
An unbiased die is tossed. Find the probability of getting a multiple of 6.
A)
\[\frac{1}{2}\] done
clear
B)
\[\frac{1}{3}\] done
clear
C)
\[\frac{2}{3}\] done
clear
D)
\[\frac{1}{6}\] done
clear
View Solution play_arrow
-
question_answer27)
The pie chart given shows the different sizes of T-shirts of a group of 40 teenagers.
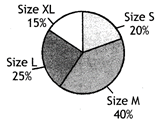
What is the angle representing those who wear size S?
A)
\[60{}^\circ \] done
clear
B)
\[48{}^\circ \] done
clear
C)
\[72{}^\circ \] done
clear
D)
\[90{}^\circ \] done
clear
View Solution play_arrow
-
question_answer28)
Identify the pie diagram representing the following data.
| Brand | A | B | C | D |
| Consumption | 30 | 30 | 20 | 20 |
A)
B)
C)
D)
View Solution play_arrow
-
question_answer29)
One card is drawn at random from a pack of 52 cards. What is the probability that the card drawn is a face card?
A)
\[\frac{1}{13}\] done
clear
B)
\[\frac{4}{13}\] done
clear
C)
\[\frac{1}{4}\] done
clear
D)
\[\frac{9}{52}\] done
clear
View Solution play_arrow
-
question_answer30)
Direction: Sales of Books (in thousand numbers) from Six Branches - A1, A2, A3, A4, A5 and A6 of a Publishing Company in 2010 and 2011 is shown in the following bar graph.  |
What is the total sales of branches A1, A3 and A5 together for both the years (in thousand numbers)?
A)
540 done
clear
B)
520 done
clear
C)
530 done
clear
D)
560 done
clear
View Solution play_arrow
-
question_answer31)
Direction: Sales of Books (in thousand numbers) from Six Branches - A1, A2, A3, A4, A5 and A6 of a Publishing Company in 2010 and 2011 is shown in the following bar graph. 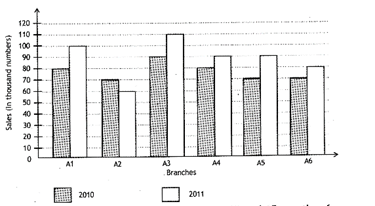 |
What is the average sale of all the branches (in thousand numbers) for the year 2010?
A)
73.5 done
clear
B)
80.4 done
clear
C)
83.2 done
clear
D)
76.6 done
clear
View Solution play_arrow
-
question_answer32)
| Direction: Sales of Books (in thousand numbers) from Six Branches - A1, A2, A3, A4, A5 and A6 of a Publishing Company in 2010 and 2011 is shown in the following bar graph. |
What is the ratio of the total sales of branch A2 for both years to the total sales of branch A4 for both years?
A)
12: 13 done
clear
B)
13:15 done
clear
C)
13:17 done
clear
D)
15 : 16 done
clear
View Solution play_arrow
-
question_answer33)
Tickets numbered 1 to 20 are mixed up and then a ticket is drawn at random. What is the probability that the ticket drawn bears a number which is a multiple of 4?
A)
\[\frac{1}{4}\] done
clear
B)
\[\frac{1}{3}\] done
clear
C)
\[\frac{1}{20}\] done
clear
D)
\[\frac{1}{2}\] done
clear
View Solution play_arrow
 done
clear
done
clear
 done
clear
done
clear
 done
clear
done
clear
 done
clear
done
clear


