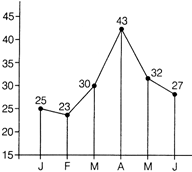
 The decrease percentage of accidents from May to June is
A) \[15\frac{3}{8}\]
B) \[15\frac{1}{8}\]
C) \[15\frac{5}{8}\]
D) \[15\frac{7}{8}\]
Correct Answer: C
Solution :
| [c] Per cent decrease in accidents in a city during the first six months in given by \[=\left( \frac{32-27}{32}\times 100 \right)%=\frac{5}{32}\times 100%\] \[=15\frac{5}{8}%\] |


You need to login to perform this action.
You will be redirected in
3 sec

