Directions : Study the following graph and answer the questions. [SSC CGL Tier II, 2015] The following graph shows production (in thousands) of two type (P and Q) of vehicles by a factory over the years 2009 to 2014. 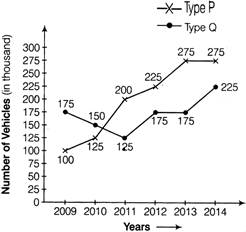 |
A) 75
B) 80
C) 81.25
D) 69.25
Correct Answer: B
Solution :
| [b] Total production of Type P vehicles in the year 2009 and 2011 = 100 + 200 = 300 (in thousand) Total production of Type Q vehicles in the year of 2010 and 2014 = 150 + 225 = 375 (in thousand) Then, required percentage\[=\frac{300\times 100}{375}=80%\] |


You need to login to perform this action.
You will be redirected in
3 sec

