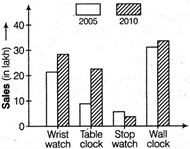
 The sales in percentage of wrist watch in 2010 more than the sales of table clock in 2010 was nearly by
A) 26.7%
B) 27.7%
C) 28.7%
D) 21.7%
Correct Answer: C
Solution :
| [c] Sale of wrist watch in year 2010 = 287 lakh Sale of table clock in year 2010 = 22.3 lakh \[\therefore \]Required percentage \[=\frac{28.7-22.3}{22.3}\times 100=28.7%\] |


You need to login to perform this action.
You will be redirected in
3 sec

