Directions: A watch company produces four different products. The sale of these products in lakhs during 2005 and 2010 are shown in the following bar diagram. Study the graph and answer the questions. [SSC CGL Tier II, 2014] 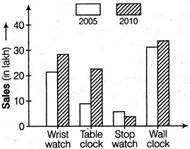 |
A) table clock
B) wrist watch
C) stop watch
D) wall clock
Correct Answer: A
Solution :
[a] From solution 12, it is clear that sales of table clock increases by 135%.


You need to login to perform this action.
You will be redirected in
3 sec

