Directions: The pie-chart provided below gives the distribution of land (in a village) under various food crops. Study the pie-chart carefully and answer the questions. 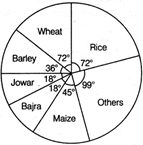 |
A) 3 : 1
B) 1 : 2
C) 2 : 1
D) 3 : 2
Correct Answer: C
Solution :
| [c] Required ratio \[=\frac{\text{ }\!\!~\!\!\text{ Land}\,\,\text{used}\,\,\text{for}\,\,\text{rice}}{\text{Land used for Barley}}\] \[\text{=}\frac{\text{Angle covered by Rice}}{\text{Angle covered by Barley}}\] \[=\frac{72{}^\circ }{36{}^\circ }=\frac{2}{1}=2:1\] |


You need to login to perform this action.
You will be redirected in
3 sec

