Directions: The following line diagram represents the yearly sales figure of a company in the years 2001-2010. Examine the diagram and answer the questions. 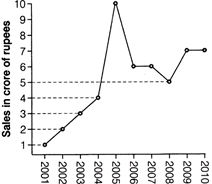 |
A) 20
B) 18
C) \[16\frac{2}{3}\]
D) \[15\frac{2}{3}\]
Correct Answer: C
Solution :
| [c] Sales in 2008 = Rs. 5 crore Sales in 2006 = Rs. 6 crore \[\therefore \]Required percentage decrease \[=\frac{6-5}{6}\times 100%=\frac{100}{6}%=16\frac{2}{3}%\] |


You need to login to perform this action.
You will be redirected in
3 sec

