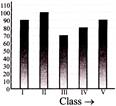
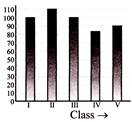
7th Class Mathematics Data Handling Question Bank Data Handling & Graphs

  • question_answer
    The given table shows the number of students in various classes of a certain school for the academic session 2016-17.
    Class I II III IV V
    Number of students 90 100 70 80 90
    Which bar graph correctly represents the given information?

    A)  

    B)  

    C)  

    D)  

    Correct Answer: A

    Solution :

    (a) Not available


You need to login to perform this action.
You will be redirected in 3 sec spinner