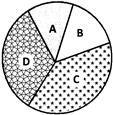
 Find the angle of the sector which represents grade C.
A) \[{{108}^{o}}\]
B) \[{{144}^{o}}\]
C) \[{{216}^{o}}\]
D) \[{{288}^{o}}\]
Correct Answer: B
Solution :
Not Available


You need to login to perform this action.
You will be redirected in
3 sec

