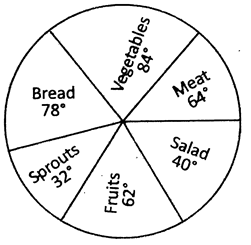
| Directions: Study the following pie chart the questions given below: |
| A Survey was conducted on 21600 people on the food items preferred by them. |
 |
A) \[8.\overline{8}%~\]%
B) \[7.\overline{9}%\]%
C) \[8.\overline{3}%~\]%
D) 7.5%
E) None of these
Correct Answer: A


You need to login to perform this action.
You will be redirected in
3 sec

