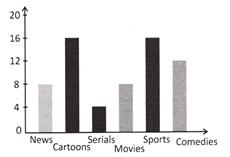
| Direction: Barograph shows the favourite TV programmes of people. See the graph and answer the following questions. |
 |
A) 8
B) 10
C) 12
D) 14
E) None of these
Correct Answer: A


You need to login to perform this action.
You will be redirected in
3 sec

