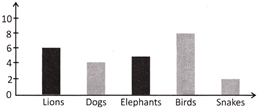
| Direction: The students of class 5 were given their choice of animals to research for a project in science. The result of their choices were displayed with the help of a bar graph look at the bar graph given below and answer the questions that follow: |
 |
A) 4
B) 6
C) 8
D) 2
E) None of these
Correct Answer: A


You need to login to perform this action.
You will be redirected in
3 sec

