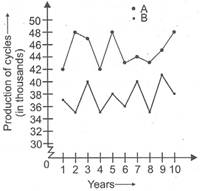
 Find the production of cycles of A in the year when combined production of cycles was maximum.
A) 47 thousands
B) 48 thousands
C) 49 thousands
D) 46 thousands
Correct Answer: A
Solution :
| Year | Production of cycles of A | Production of Cycles of B | Combined Production |
| 1 | 42 | 37 | 79 |
| 2 | 48 | 35 | 83 |
| 3 | 47 | 40 | 87 |
| 4 | 42 | 35 | 77 |
| 5 | 48 | 38 | 86 |
| 6 | 43 | 36 | 79 |
| 7 | 44 | 40 | 84 |
| 8 | 43 | 35 | 78 |
| 9 | 45 | 41 | 86 |
| 10 | 48 | 38 | 86 |


You need to login to perform this action.
You will be redirected in
3 sec

