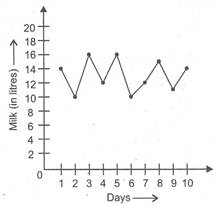
 On an average, how much milk he sells every day?
A) 10 litres
B) 12.5 litres
C) 11 litres
D) 13 litres
Correct Answer: D
Solution :
Average = \[=\frac{14+10+16+12+16+10+12+15+11+14}{10}\] \[\text{=}\frac{\text{130}}{\text{10}}\text{=13}\,\,\text{litres}\]


You need to login to perform this action.
You will be redirected in
3 sec

