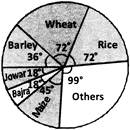
 Study the pie chart and answer the following questions. If the total area under Jowar was \[1.5\] million acres, what was the area (in millions acres) under rice?
A) \[6\]
B) \[7.5\]
C) \[9\]
D) \[4.5\]
Correct Answer: A
Solution :
The area under any of the food crops is proportional to the central angle corresponding to that crop. Let, the area under rice production be x million acres. Then, \[18:72=1.5:x\] \[\Rightarrow \] \[x=\left( \frac{72\times 1.5}{18} \right)=6\]


You need to login to perform this action.
You will be redirected in
3 sec

